Wedge patterns are among the most reliable reversal signals in technical analysis when you know what to look for. They show up regularly across all kinds of stocks, and traders who can spot them early gain a meaningful edge. This article breaks down exactly what rising and falling wedges are, why they form, what forces are driving the price action underneath the surface, and how to trade them with discipline and precision. Then, we'll conclude with a trading exercise to practice these patterns in the Trading Blitz simulator.
What Is a Wedge Pattern and How Do You Identify One?
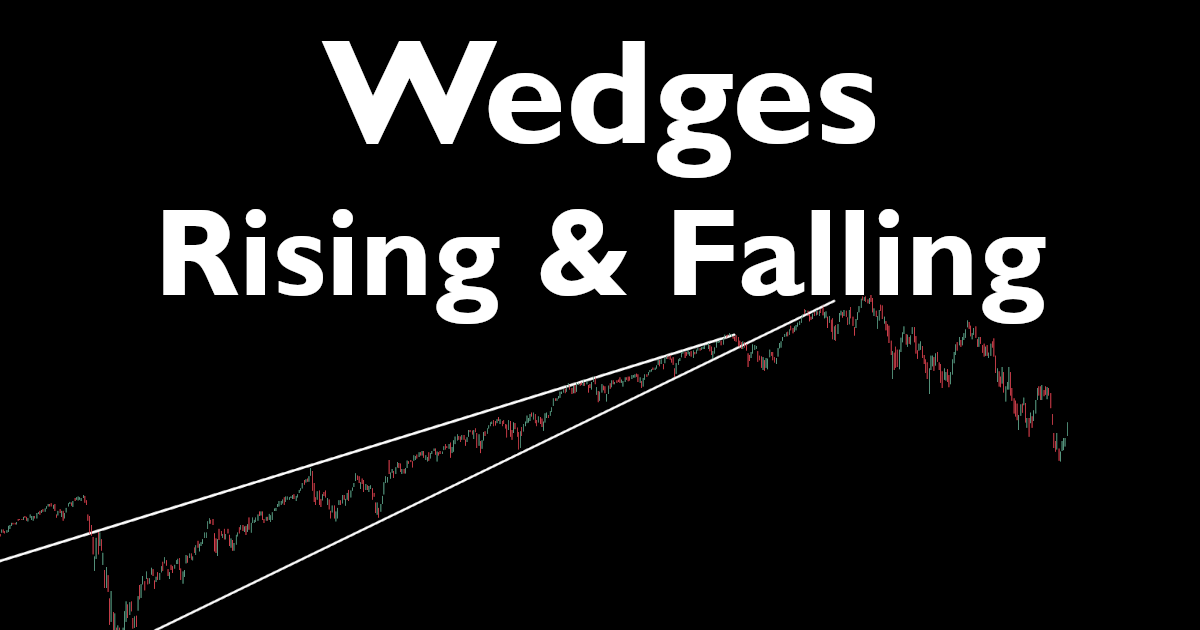
A wedge is a price pattern defined by two converging trendlines, an upper resistance line and a lower support line, that both slope in the same direction. That's the key distinction from a triangle, where one line is typically flat. Both trendlines tilt either upward or downward together, compressing price into a tightening range as it moves toward the apex.
There are two types:
- Rising Wedge: Both trendlines slope upward. Higher highs and higher lows, but the highs are rising more slowly than the lows. The range is squeezing as price pushes up. This is typically a bearish reversal signal.
- Falling Wedge: Both trendlines slope downward. Lower highs and lower lows, but the lows are falling more slowly than the highs. Again, the range is compressing. This is typically a bullish reversal signal.
To confirm a wedge, you want to see price touch each trendline at least twice, three touches is stronger. Volume should generally be declining as the pattern matures, reflecting diminishing conviction from the dominant side.
Why Do Wedge Patterns Form? Understanding the Market Forces Behind Them
The why matters more than the pattern itself, because understanding causation helps you trust the signal when it counts.
The Rising Wedge: Exhausted Bulls
A rising wedge typically forms after a strong upward move. Price continues climbing, but something is changing beneath the hood. Each new high requires less enthusiasm to achieve, the rallies are getting shorter and shorter relative to the prior advance. Meanwhile, sellers are stepping in at progressively lower levels, which is why the resistance line is rising more slowly than support.

Retail buyers are still chasing the move, conditioned by recent success. Institutional traders, however, are quietly distributing shares into that buying pressure. They're selling into strength, not weakness. Volume declining on each push higher is the tell, there's less and less real demand fueling each wave up. When the pattern breaks down, it often does so sharply, because the retail buyers who drove the final leg have no floor beneath them. Algorithms also accelerate the move, triggering stop losses below support, which cascade into a rapid selloff.
The Falling Wedge: Exhausted Bears
The falling wedge is the mirror image. Price is declining, but the selling pressure is losing steam. Each successive low is less dramatic than the previous one, sellers can't push as hard as they used to. Smart money is beginning to accumulate, buying into weakness quietly while the chart still looks bearish to most observers.

When price finally breaks above the upper trendline, it catches short sellers off guard. They scramble to cover, adding fuel to the upside breakout. This short-covering dynamic is one reason falling wedge breakouts can be explosive. You're combining new buyers entering long with existing shorts forced to exit simultaneously.
3 Steps To Trade Wedge Patterns With Confidence
- Identify the wedge early. Draw your trendlines as soon as you have two confirmed touches on each side. Don't wait for the breakout. Anticipating the pattern could give you a better risk-reward setup.
- Wait for the breakout candle. A closing price beyond the trendline carries far more weight than an intraday pierce. Many false breakouts reverse before the close. Patience here saves you from a lot of head fakes.
- Measure your price target. The classic target is derived by taking the height of the wedge at its widest point (the base) and projecting that distance from the breakout point. This gives a realistic minimum target, not a guarantee.
How To Avoid False Breakouts When Trading Wedge Patterns
False breakouts are the number one frustration for wedge traders. A few filters help significantly. First, volume should expand on the breakout bar, a price break on light volume is suspicious. Second, look for confirmation the following day. If the stock closes back inside the wedge the next session, that's a red flag. Third, consider the broader market trend. A falling wedge in a stock during a strong bull market is far more reliable than the same pattern during a broad market selloff.
According to Thomas Bulkowski's research in Encyclopedia of Chart Patterns, falling wedges break out upward about 68% of the time, and rising wedges break out downward roughly 69% of the time when the pattern completes fully. These aren't coin flips, but they also aren't certainties, which is exactly why stop losses are non-negotiable.
A Professional Strategy: Kathy Lien's Wedge Breakout Framework
Kathy Lien, co-founder of BK Asset Management and author of Day Trading and Swing Trading the Currency Market, uses a clean wedge breakout approach that adapts well to stock charts. Her framework emphasizes patience, confirmation, and defined risk.
Here are her core rules adapted for daily stock charts:
- Entry: Enter on the first closing bar that breaks cleanly through the trendline. Do not enter mid-bar or on an intraday spike.
- Stop Loss: Place your stop on the opposite side of the breakout candle. For a falling wedge breakout to the upside, the stop goes just below the low of the breakout bar. Keep it tight but logical.
- Target: Use the measured move (height of wedge projected from the breakout point) as your first target. Consider taking partial profits there and letting the remainder ride with a trailing stop.
- Volume Confirmation: Only take the trade if breakout volume exceeds the prior three-day average. This filters out a significant portion of false breaks.
How To Practice Trading Wedge Patterns on the Simulator
Here's your assignment. Open Trading Blitz and reset your Game History from the Dashboard. This ensures you have clean statistics when you review your performance. Next, enter Solo mode and begin loading new charts until you find one showing a clear wedge forming near the end of the visible price history. Look for converging trendlines with declining volume. If you're a premium member, use the Breakout or Breakdown chart filters to find charts already flagged near potential wedge completions, which saves time and focuses your reps.
Once you've found a setup, follow Kathy Lien's rules precisely:
- Draw both trendlines on the chart and confirm at least two touches per line.
- Advance the chart day by day using the Next Day button and wait for a confirmed closing breakout.
- Enter your trade using a market order on the breakout close. Set your stop loss using a stop order just beyond the breakout candle's low (for longs) or high (for shorts).
- Wait for the stock price to approach your target. If it does, cancel your stop order and exit the position to capture your profits. Note - The simulator can only have one open order (stop or limit).
- Record your observations in the Notes section of the simulator. Did volume expand? Did the stock follow through the next day? Did it hit the measured target?
Run this exercise across at least twenty different wedge chart patterns. Then, review your statistics and observations. Your goal isn't just to profit, it's to build pattern recognition and decision-making speed. The simulator strips away the emotional noise of real money, so you can focus entirely on reading the chart. Treat every session like it counts, because the habits you build here are the ones you'll bring to live markets.
What the Wedge Pattern Teaches You About Market Psychology
Beyond the trade signal itself, wedge patterns reveal something important about how markets cycle through greed and fear. The rising wedge is a story of thinning conviction. Buyers slowly lose ground while thinking they're still winning. The falling wedge is the opposite, sellers burning out while the smart money quietly repositions. Learning to read these stories in price action is a skill that compounds over time, one chart at a time.
Free Cash-Prize Touraments
We run free cash-prize tournaments (no entry fee required) when we go live on YouTube. Be sure to subscribe to our channel - @TradingBlitzSimulator - to get alerted when we go live next.
Citations
- Bulkowski, T. N. (2005). Encyclopedia of Chart Patterns (2nd ed.). Wiley Trading.
- Lien, K. (2008). Day Trading and Swing Trading the Currency Market. Wiley.
- Murphy, J. J. (1999). Technical Analysis of the Financial Markets. New York Institute of Finance.
Disclaimer: Trading involves substantial risk of loss and is not appropriate for all investors. The information provided on Trading Blitz is for educational and informational purposes only. Nothing on this platform, including this article, constitutes financial advice, investment advice, or a recommendation to buy or sell any security. Simulated trading results do not guarantee or predict future performance in live markets. Past performance, whether real or simulated, is not indicative of future results. Always consult a qualified financial professional before making any investment decisions. For additional information, please see our Terms of Service.
Affiliate Disclosure: Some links in this article may be affiliate links. If you click through and make a purchase, Trading Blitz may earn a small commission at no additional cost to you. We only reference tools and resources we believe are relevant to traders.