Breakout trading sits near the top of most technical traders' playbooks, and for good reason. When price breaks through a well-established level of resistance or support, it often signals a shift in the underlying supply and demand balance, and that shift can produce some of the cleanest, most profitable moves on a chart. The problem is that not every breakout is the real thing. Some are traps. Some are just noise. And without knowing which patterns carry the highest probability of success, you're essentially guessing.
This article breaks down the most common breakout patterns, their historical success rates, why they work when they do, and how to practice trading them the right way.
What Is a Breakout and Why Do They Happen?
A breakout occurs when price moves decisively beyond a defined level of support or resistance. But why does this generate follow-through movement? It comes down to a collision of psychology and mechanics.
When a stock tests the same resistance level repeatedly, sellers accumulate at that level. Traders who bought lower place sell orders there to take profits. Short sellers initiate positions expecting the level to hold. When price finally clears that level with conviction, all of those short sellers need to buy to cover, and all of the traders who were waiting on the sidelines now fear missing the move. This creates a surge of buy orders. That surge is the breakout. Institutions add fuel to the fire because algorithmic systems are programmed to enter on confirmed breakouts above moving averages, trend lines, and price consolidation zones. The mechanics are self-reinforcing, at least temporarily.
The key word there is "temporarily." Without the right context and pattern structure, breakouts fail at a surprisingly high rate. Research by Thomas Bulkowski, documented in his Encyclopedia of Chart Patterns, found that across thousands of chart pattern samples, breakout failure rates can range from as low as 4% to as high as 65% depending on the pattern type. That's a massive range. Knowing which patterns fall on which end of that spectrum matters enormously.
3 High-Probability Breakout Patterns and Their Success Rates
1. The Ascending Triangle: How To Trade Bullish Breakouts with a Flat Top
The ascending triangle is a bullish continuation pattern characterized by a flat upper resistance line and a rising lower trendline. Each pullback finds support at a higher low, which tells you that buyers are becoming increasingly aggressive. They're not willing to wait for price to fall as far before buying. Eventually, the sellers at resistance run out of supply and price breaks through.

Bulkowski's research across 803 ascending triangle patterns found a breakout success rate of approximately 75% when the breakout is upward, meaning price continued to move higher by at least the height of the triangle. That makes it one of the more reliable patterns in the breakout trader's toolkit.
Why does it work? The rising lows demonstrate that institutional accumulation is happening beneath the surface. Large players are quietly building positions, and the flat resistance top is simply the level at which enough supply exists to temporarily cap the move. Once that supply is absorbed, institutions finish the job.
- Entry: Buy the close above the flat resistance line, ideally on above-average volume.
- Price Target: Measure the height of the triangle at its widest point and project that distance upward from the breakout point.
- Stop-Loss: Just below the most recent higher low within the triangle.
2. The Cup and Handle: What Is the Success Rate of This Classic Breakout Pattern?
The cup and handle was popularized by William O'Neil, the founder of Investor's Business Daily and the CANSLIM growth investing methodology. It's a bullish continuation pattern where price forms a rounded bottom (the cup) followed by a smaller, relatively shallow pullback (the handle) before breaking out to new highs.

O'Neil's own research, compiled through decades of studying the biggest stock market winners, found that the cup and handle pattern preceded some of the greatest stock advances in history, including early moves in stocks like Apple, Google, and Amazon. Bulkowski's independent analysis placed the upward breakout success rate for cup and handle patterns at approximately 68%, with an average advance of around 34% after the breakout when the pattern meets quality criteria.
The psychology here is nuanced. The cup represents a full cycle of selling pressure followed by recovery. Weak holders are shaken out during the cup's formation. The handle is the final shakeout before institutions take the stock price higher. The sellers who form the handle are typically people who bought when the cup initially began breaking down weeks earlier, and now they are just looking to break even. When institutions want in on a strong growth story, they use the handle's pullback to accumulate shares at a slight discount before driving price through resistance. When the break even sellers see this after selling, they experience FOMO and chase the price as it accelerates higher, adding fuel to the fire.
- Entry: Buy the breakout above the handle's resistance, confirmed with a volume surge.
- Price Target: Project the depth of the cup upward from the breakout point.
- Stop-Loss: Below the low of the handle, typically 7-8% below the entry, consistent with O'Neil's original rule.
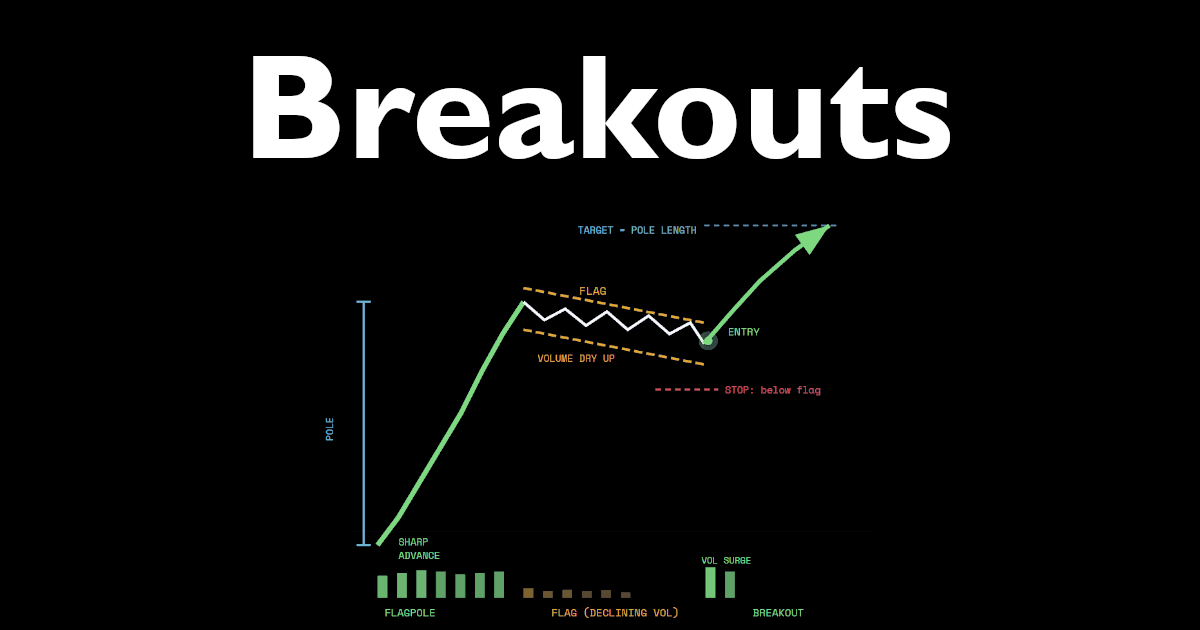
3. The Bull Flag: How To Identify and Trade This Short-Term Breakout Pattern
The bull flag is one of the most common and fastest-developing breakout patterns. It forms after a sharp, nearly vertical price advance (the flagpole), followed by a brief, orderly pullback that forms parallel downward-sloping trendlines (the flag). Volume typically dries up during the flag consolidation and surges again on the breakout.

Bulkowski's research on bull flag patterns found a success rate of approximately 67% for upward breakouts in bull markets, with an average gain of around 25% following a confirmed breakout. The pattern tends to be faster-moving than the ascending triangle or cup and handle, which makes it popular among short-term momentum traders.
The mechanics are straightforward. The flagpole shows that buyers have overwhelmed sellers in a hurry. The flag is simply profit-taking by traders who were long from lower prices. Volume contracting during the flag confirms that selling pressure is light, meaning the pullback is corrective rather than distributive. When new buyers step in, price resumes the original direction quickly.
- Entry: Buy the breakout above the upper trendline of the flag on a volume spike.
- Price Target: Project the length of the flagpole upward from the breakout point.
- Stop-Loss: Below the lower trendline of the flag.
What Separates Real Breakouts from Fakeouts
Bulkowski found that roughly 20-40% of breakouts, depending on the pattern, fail within the first few days and reverse back through the breakout level. These are called fakeouts or false breakouts. Understanding why they happen helps you filter them out.
Fakeouts typically occur in one of three scenarios. First, low volume on the breakout day signals a lack of institutional participation. Without large buyers stepping in, the move has no fuel behind it. Second, broader market weakness can overwhelm even the strongest individual stock setup. A stock breaking out while the major indices are selling off faces serious headwinds. Third, breakouts through horizontal resistance that has been tested many times are more prone to failure because each test depletes the supply of sellers, but it also gives savvy traders time to place orders just above the level, creating a hunting ground for stop-running algorithms.
The single best filter for separating real breakouts from fakeouts is volume. As a rule of thumb, look for breakout day volume to be at least 40-50% above the stock's average daily volume. Combined with RSI above 50 at the time of breakout, the odds of follow-through improve meaningfully.
How To Confirm Breakouts Using Indicators Available on Trading Blitz
Technical confirmation is your second opinion. Here are three indicators worth layering on top of any breakout pattern, all available on the Trading Blitz simulator.
Volume: Already covered above, but worth repeating. Volume is the most important confirming indicator for any breakout. It's the difference between a crowd and a flash mob.
Moving Averages: A breakout occurring above the 50-day simple moving average (SMA) is more powerful than one occurring below it. When price is already above its 50-day SMA, trend traders and their algorithms are already aligned with the direction of the trade. Breakouts that occur with price beneath major moving averages face significant overhead resistance from those systems.
Relative Strength Index (RSI): An RSI reading above 50 at the time of breakout confirms that momentum is on your side. RSI crossing above 50 after a consolidation period is a particularly strong signal. However, be cautious entering breakouts when RSI is already above 75, as the stock may be short-term overbought and due for a pause, even if the longer-term trend remains intact.
Breakout Trade Management: Entry, Stop-Loss, and Profit Targets
Even the best setup in the world gets ruined by poor trade management. Here's a practical framework.
Aggressive Entry: Enter on the close of the breakout day if volume confirms. You pay a slightly higher price but avoid missing the move entirely if the stock gaps up the next morning.
Conservative Entry: Wait for a pullback retest of the broken resistance level, which often becomes new support. You get a better entry price, but roughly 40% of breakouts never retest, so you'll miss some trades with this approach.
Stop-Loss: Place your stop just below the breakout level. Many traders use the Average True Range (ATR) indicator to determine a logical buffer, placing the stop one ATR below the breakout level to account for normal daily price noise without getting shaken out by a minor wiggle.
Profit Targets: Use the measured move technique for each pattern. For flags, project the flagpole. For triangles and cups, project the height of the pattern. Trail your stop as the trade moves in your favor to lock in gains without capping upside prematurely.
How To Practice Breakout Trading Patterns on the Trading Blitz Simulator
Here is your assignment, structured around William O'Neil's cup and handle breakout method, combined with volume confirmation. This is a well-documented, research-backed strategy that fits cleanly within what the Trading Blitz simulator offers.
The Assignment: O'Neil Cup and Handle Breakout Strategy
Objective: Identify and trade cup and handle breakout patterns using volume confirmation and a defined stop-loss rule.
Setup: If you are a Premium member, use filters when loading new charts. You can use one of the MACD crossunder filters, Pullback, Breakout, or Breakdown. These will serve you charts where the stock is more likely to be forming bottoming patterns (i.e. left side of the cup-and-handle), flags (i.e. handle pullback), or the right side of the cup-and-handle (i.e. breakouts). Click Next Day to see how the pattern unfolds. If you are not a premium member, simply load new charts until you find one that shows a clear prior uptrend, followed by a rounded consolidation resembling a cup shape. Remember to reset your trade history in order to collect clean statistics for this assignment.
Step-by-Step Rules:
- Reset Game History in Dashboard to ensure you're not including old data in your results.
- Load a new chart. Spend time reviewing the chart history to identify a cup-shaped consolidation. The cup should be relatively smooth and rounded, not V-shaped. A V-shape suggests a sharp selloff and recovery, which is less reliable than a gradual, rounded base.
- Identify the handle. After the cup's right lip forms near the prior high, look for a shallow pullback of no more than 10-15% that forms a small consolidation or mild downtrend lasting at least one to two weeks.
- Draw the resistance line across the high of the handle. This is your breakout trigger.
- Add a volume indicator and a 50-day SMA to the chart.
- Advance the chart day by day using the Next Day button. When price closes above the handle's resistance, check the volume. If it is clearly elevated above the recent average, place a market order to buy. If volume is weak or average, skip the trade and continue to the next chart.
- Place a stop-loss order immediately after entering. Per O'Neil's original rules, place it 7-8% below your entry price. This is non-negotiable.
- Set a mental profit target equal to the depth of the cup projected upward from the breakout point. When price reaches that target, cancel the stop loss order and exit the position using a market order.
- Record whether the breakout succeeded or failed in the simulator's Notes section, and whether volume was elevated on the breakout day. After 15 trades, review your trade log and Dashboard statistics.

What You're Training: Pattern recognition for the cup and handle structure, volume reading for breakout confirmation, disciplined stop-loss execution, and target-based profit taking. These are four of the most important skills any breakout trader can develop.
Try the challenge mode once you feel comfortable. The 90-second clock adds a layer of pressure that will sharpen your ability to scan a chart and identify the setup quickly, which is exactly the skill you need when trading live markets where decisions happen fast.
Free Cash-Prize Touraments
We run free cash-prize tournaments (no entry fee required) when we go live on YouTube. Be sure to subscribe to our channel - @TradingBlitzSimulator - to get alerted when we go live next.
Citations
- Bulkowski, Thomas N. Encyclopedia of Chart Patterns, 3rd Edition. Wiley Finance, 2021.
- O'Neil, William J. How to Make Money in Stocks: A Winning System in Good Times and Bad, 4th Edition. McGraw-Hill Education, 2009.
- O'Neil, William J. The Successful Investor. McGraw-Hill Education, 2004.
Disclaimer: Trading and investing in financial markets involves substantial risk of loss and is not appropriate for every investor. The information provided on Trading Blitz, including all articles, charts, simulations, and other content, is intended solely for educational and informational purposes. Nothing on this platform constitutes financial advice, investment advice, trading advice, or any other type of advice, and should not be construed as such. Past performance in the simulator does not guarantee or predict future results in real financial markets. All trading on Trading Blitz uses virtual currency and does not involve real money. You should consult a qualified financial professional before making any actual investment or trading decisions. For additional information, please see our Terms of Service.
Affiliate Disclosure: Some content on Trading Blitz includes affiliate links. If you click an affiliate link and make a purchase, we may earn a commission. This does not affect the price you pay.