The cup and handle is one of the most elegant and reliable continuation patterns in technical analysis. William O'Neil, founder of Investor's Business Daily and the man behind the famous CANSLIM growth stock system, popularized the pattern in his 1988 book How to Make Money in Stocks. Decades later, it remains a staple in the playbooks of both retail swing traders and institutional growth investors. If you've ever struggled to find high-probability breakout setups, understanding this pattern is a genuinely useful skill to develop.
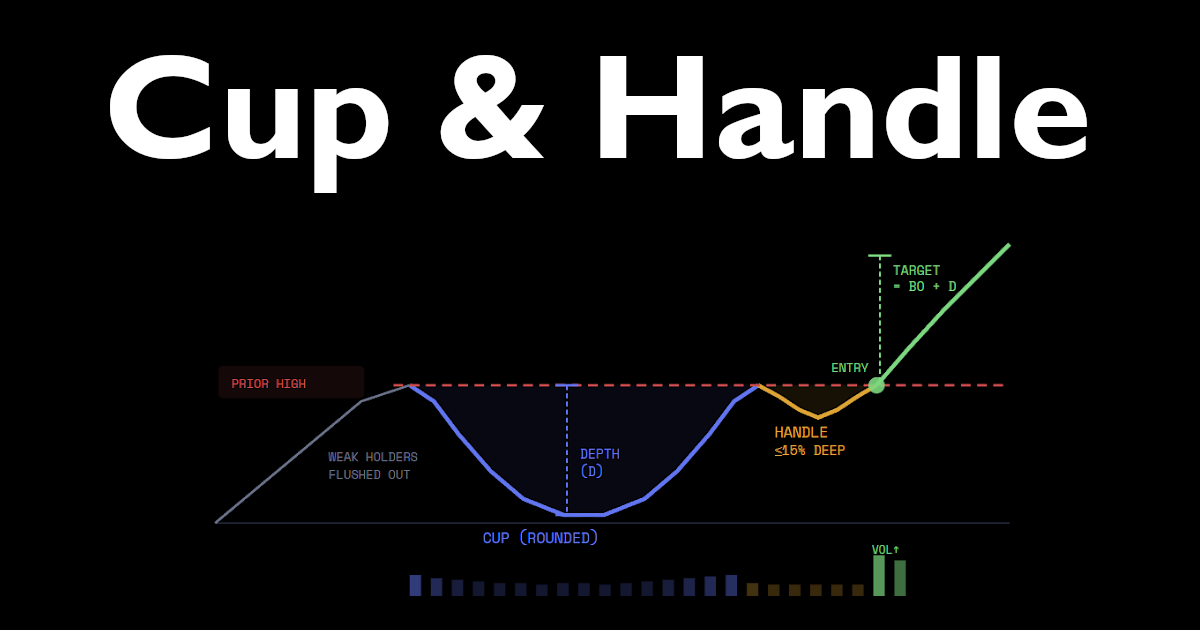
The basic idea is simple: a stock makes a strong advance, rounds off into a smooth U-shaped correction, then tightens into a brief consolidation before breaking out to new highs. That tightening phase is the "handle," and it's where the real trade lives.
What Is the Cup and Handle Pattern and How Does It Form?
The cup forms when a stock pulls back from a prior high and then recovers gradually over several weeks or months. The key word is gradually. A sharp V-shaped recovery typically signals weak institutional accumulation and is generally not considered a valid cup. A proper cup has a gentle, rounded bottom, more of a soup bowl than a shot glass, reflecting steady buying pressure slowly absorbing the available supply.

O'Neil's original research, documented across decades of winning stocks, found that ideal cups form over 7 to 65 weeks and correct between 12% and 33% from the prior high. In stronger bull markets, shallower cups of 12% to 15% are common. In weaker markets or during broad corrections, cups can run as deep as 50%, though deeper cups carry statistically lower success rates.
After the cup completes, the stock enters the handle phase. The handle is a mild downward drift or tight sideways consolidation that typically lasts one to four weeks. Volume dries up during this phase, which is a critical clue. Low volume during the handle tells you that selling pressure is exhausted. The remaining shareholders are simply not motivated to sell. When the stock finally breaks above the handle's upper resistance level on elevated volume, it signals that institutional buyers have stepped in decisively.
3 Key Characteristics of a Valid Cup and Handle Setup
- Prior Uptrend: The cup and handle is a continuation pattern. It requires a meaningful prior uptrend, ideally at least 30% before the pattern begins. Without a strong prior advance, you're not looking at a base being built for higher prices, you're looking at sideways noise.
- Rounded Cup Base: The bottom of the cup should be rounded, not jagged or V-shaped. Rounded bases indicate accumulation, large funds quietly buying shares over time without telegraphing their moves to the market.
- Handle Below the Prior High: The handle must form in the upper half of the cup and ideally within 10% to 15% of the prior high. A handle that drifts too low often signals that the stock hasn't fully shaken out weak holders, and the breakout has lower odds of following through.

How To Find the Ideal Buy Point in a Cup and Handle
O'Neil's buy point is precise: the high of the handle plus $0.10. This forces the trader to wait for an actual price commitment rather than anticipating a breakout that may never come. The entry is confirmed when the stock clears the handle's resistance on volume at least 40% to 50% above its average daily volume. That volume surge is not optional, it's the institutional fingerprint that separates genuine breakouts from false ones.
Why does the buy point work? When a stock approaches a prior high, early buyers who are sitting on losses from that prior peak are motivated to sell and break even. This selling pressure is what creates the handle itself. Once that supply is absorbed and the stock clears the level, the path of least resistance is upward and there's no longer a wall of frustrated sellers overhead. Institutional algorithms are also programmed to trigger buy orders at breakout levels from recognized chart patterns, which creates a self-reinforcing dynamic once the level is cleared.
How To Avoid False Breakouts in Cup and Handle Patterns
False breakouts are the primary frustration with any breakout strategy. Several red flags signal that a cup and handle setup is likely to fail:
- Low breakout volume: If the stock clears the handle on below-average volume, institutions are not participating. Retail-driven breakouts fade quickly.
- A wedging handle: If the handle forms as a series of lower highs and lower lows in a tight downward wedge, it can still be valid. But if the handle is wide and loose with erratic price swings, it signals distribution — not healthy consolidation.
- Late-stage bases: O'Neil specifically noted that first and second-stage bases have the highest success rates. A stock that has already had multiple breakouts and extended runs is forming a later-stage base, which carries significantly higher failure risk. By the time a pattern is widely recognized, much of the easy money has already been made.
- Weak market conditions: Three out of four stocks move in the direction of the general market. Trading cup and handle breakouts during a confirmed market downtrend is swimming upstream.
What Are Realistic Profit Targets for a Cup and Handle Trade?
O'Neil recommended a measured move target calculated by taking the depth of the cup and adding it to the breakout point. For example, if a stock bottomed at $70 during the cup and broke out at $100, the depth is $30, giving a target of $130. This method is mechanical and doesn't account for changing market conditions, so many traders use it as a guide rather than a hard exit rule.
On the risk side, a stop loss is typically placed just below the low of the handle, often 7% to 8% below the buy point. O'Neil famously advocated for cutting losses at exactly 8% — no exceptions. This strict rule keeps individual losing trades from damaging your overall account, which is the discipline that allows a strategy with a relatively modest win rate to remain profitable over time.
How To Practice Identifying Cup and Handle Patterns on the Simulator
The assignment below is based on William O'Neil's cup and handle methodology as outlined in How to Make Money in Stocks. The goal is to build pattern recognition and practice disciplined entry and exit execution.
Your Assignment: The O'Neil Cup and Handle Breakout Strategy
Objective: Identify a valid cup and handle pattern and execute a disciplined breakout trade using O'Neil's rules.
- Reset your history. Remember to click Reset Game History on your Dashboard to clear your statistics to ensure you clear out any old data.
- Load a new chart. If you have a Premium account, use the Breakout pattern filter to increase the odds of loading a chart near a breakout. Otherwise, load new charts until you find one that shows a clear prior uptrend followed by a rounded correction and recovery.
- Evaluate the cup. Confirm the cup is U-shaped, not V-shaped. Check that the correction from the prior high is roughly 12% to 50%. If the recovery side of the cup is jagged or sharp, skip the chart and load a new one.
- Identify the handle. Look for a brief pullback or tight consolidation forming in the upper half of the cup. Volume should visibly contract during the handle. If the handle is wide and volatile, pass on the trade.
- Mark the buy point. Identify the high of the handle. Your simulated entry trigger is a close above that level.
- Set your stop loss. Place a stop loss order 7% to 8% below your buy point immediately after entering the trade. Do not skip this step.
- Advance day by day. Click Next Day and watch for the breakout. If the stock clears the handle on strong volume, enter with a market order. If the breakout comes on weak volume, wait one additional day to see if volume confirms.
- Manage the trade. If the stock rallies 20% to 25% from your entry, consider taking partial profits. If it drops and hits your stop, exit without hesitation and record the trade in your log.
- Review your results. After ten to twenty completed trades, check your dashboard statistics. Look at your win rate and average profit versus average loss. A profitable application of this strategy should show average gains that are meaningfully larger than average losses, even if your win rate is below 50%.
Repeat this process across multiple charts and sessions. Pattern recognition improves with repetition, and the simulator lets you compress months of market exposure into a single sitting. The traders who get the most out of this exercise are the ones who treat every click of the Next Day button as a real decision, not a game.
Citations
- O'Neil, William J. How to Make Money in Stocks: A Winning System in Good Times and Bad. McGraw-Hill, 1988 (4th ed. 2009).
- Minervini, Mark. Trade Like a Stock Market Wizard. McGraw-Hill, 2013.
- Murphy, John J. Technical Analysis of the Financial Markets. New York Institute of Finance, 1999.
Disclaimer: Trading involves substantial risk of loss and is not appropriate for all investors. The information provided on Trading Blitz is for educational and informational purposes only. Nothing on this platform, including this article, constitutes financial advice, investment advice, or a recommendation to buy or sell any security. Simulated trading results do not guarantee or predict future performance in live markets. Past performance, whether real or simulated, is not indicative of future results. Always consult a qualified financial professional before making any investment decisions.