Candlestick charts have been around since 18th-century Japan, where rice trader Munehisa Homma reportedly used price pattern analysis to accumulate enormous wealth. The same visual logic he pioneered still drives modern trading decisions today. That's either a testament to timeless human psychology or proof that markets really do rhyme ... probably both.
Each candlestick tells a story: where price opened, where it closed, and how far it traveled in between. The relationship between those data points reveals the ongoing battle between buyers and sellers. Learn to read that story well, and you'll have a meaningful edge in identifying when momentum is shifting and when it isn't.
What Is a Candlestick and How Do You Read One?
A single candlestick has three components: the body (the thick rectangular section between the open and close), the upper wick (or shadow, extending above the body), and the lower wick (extending below). A green or white candle means price closed higher than it opened. A red or black candle means the opposite.
The wicks matter just as much as the body. A long upper wick means buyers pushed price up aggressively but sellers rejected that move before the close. A long lower wick means sellers drove price down hard, but buyers stepped in and reclaimed the loss. These rejection signals are where the most powerful candlestick patterns originate.
How To Identify the 5 Most Popular Bullish Candlestick Patterns

1. The Hammer
The hammer forms at the bottom of a downtrend. It has a small body near the top of the candle and a long lower wick, typically at least twice the length of the body. Sellers pushed price down sharply during the session, but buyers recovered nearly all of those losses by the close. The result is a candle that visually looks like a hammer with a short handle pointing downward.
Why does it work? Institutional buyers often accumulate at key support levels where they see value. Their buying absorbs the selling pressure, creating the characteristic long tail. Retail traders with short positions start covering, which adds fuel to the reversal. Algorithms watching volume spikes and price-level reactions trigger buy signals simultaneously. When all three forces align, the bounce can be significant.
2. The Bullish Engulfing Pattern
A bullish engulfing pattern forms when a red candle is followed by a green candle whose body completely engulfs the prior day's body. The green candle opens below the previous close and closes above the previous open. This is a two-candle reversal signal that frequently appears at the end of downtrends or after a pullback within an uptrend.
The engulfing logic is straightforward: whatever selling pressure drove the previous session was completely overwhelmed by buying in the next session. Institutions often initiate large positions on such days, absorbing the available supply and driving price higher. Studies referenced in the CMT curriculum show that engulfing patterns near key support levels carry significantly higher predictive reliability than those appearing in choppy, trendless conditions.
3. The Inverted Hammer
Similar to the hammer but flipped upside down, the inverted hammer has a small body near the bottom of the candle and a long upper wick. It appears in downtrends and signals a potential reversal. Buyers attempted a rally but couldn't hold the gains. Importantly, though, sellers couldn't push the price much lower from the open either. That's the subtle shift in momentum worth watching.
4. The Morning Star
The morning star is a three-candle pattern. First comes a strong red candle. Then a small-bodied candle (either color) that gaps down, showing indecision. Finally, a strong green candle that closes well into the body of the first red candle. This three-session sequence shows a clear transition from seller dominance to buyer dominance and is considered one of the more reliable bullish reversal signals in technical analysis.
5. The Dragonfly Doji
A doji forms when the open and close are nearly identical, leaving little to no body. The dragonfly doji specifically has a long lower wick and almost no upper wick. It represents a session where sellers pushed prices down aggressively, only to have buyers recover the entire move before the close. At key support levels, this is a significant signal of demand stepping in decisively.
How To Identify the 4 Most Popular Bearish Candlestick Patterns

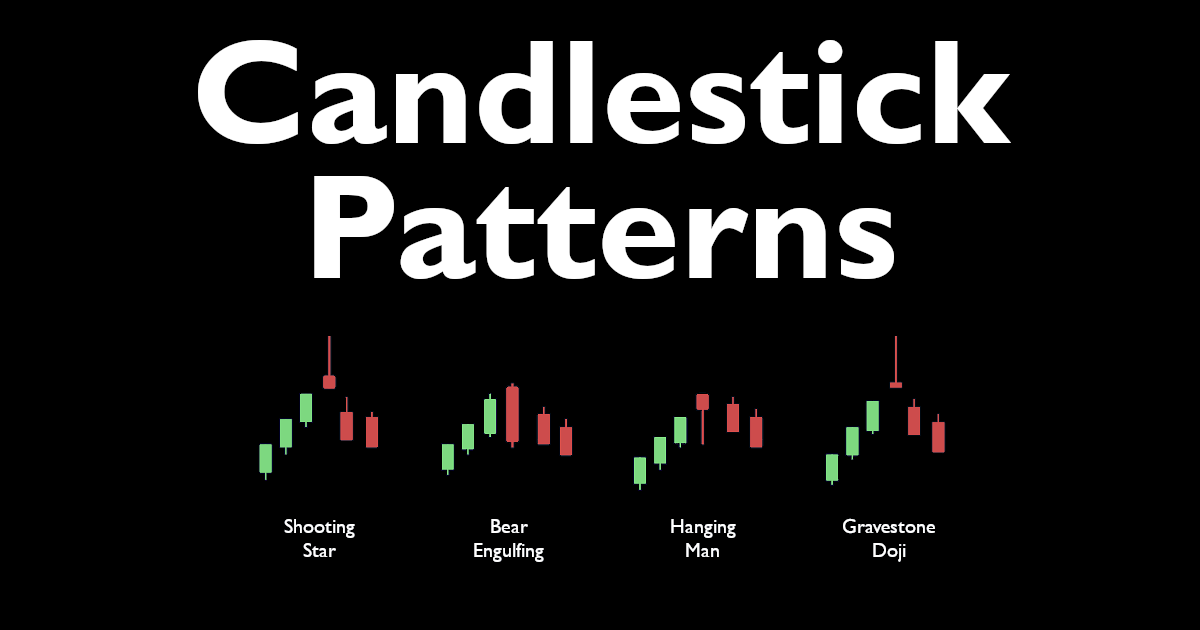
1. The Shooting Star
The shooting star is the bearish counterpart to the inverted hammer. It appears at the top of an uptrend and features a small body near the bottom of the candle with a long upper wick. Buyers drove price higher during the session, but sellers rejected the advance and pushed it back near the open. The long wick is a price rejection signal at resistance.
2. The Bearish Engulfing Pattern
Just like its bullish counterpart but in reverse, a bearish engulfing occurs when a green candle is followed by a red candle that completely engulfs the prior body. The red candle opens above the prior close and closes below the prior open. This is a reliable reversal signal when it appears at resistance or after an extended uptrend.
3. The Hanging Man
The hanging man looks exactly like a hammer in shape, but context changes everything. When a candle with a small body and long lower wick appears after an uptrend, it's a bearish warning, not a bullish one. Sellers tried to take control during the session, and while buyers recovered, the selling attempt itself is the warning shot. Confirmation from the next session is important before acting on it.
4. The Gravestone Doji
The gravestone doji is the mirror image of the dragonfly. It has a long upper wick, almost no lower wick, and a very small or nonexistent body near the bottom of the range. At the top of an uptrend or at resistance, this signals that buyers pushed hard but were completely rejected. Sellers had the final say, and price closed at or near the session low.
3 Rules for Trading Candlestick Patterns More Effectively
- Always consider the context. A hammer at a major support level after a sustained downtrend is meaningful. A hammer appearing in the middle of a sideways range is background noise. Pattern location on the chart matters enormously.

- Wait for confirmation. Most candlestick patterns benefit from confirmation in the following session. A bullish engulfing followed by a green open the next day is much more actionable than one that gaps down immediately after forming.
- Combine with volume. Reversal candles that form on above-average volume carry significantly more weight. High volume confirms that institutional participation backed the move, not just retail noise.
How To Practice Identifying Candlestick Patterns on the Simulator
Japanese candlestick pattern trading has been studied and formalized by many professionals, but Thomas Bulkowski's statistical research in Encyclopedia of Candlestick Charts (2008) is among the most rigorous and widely cited. Bulkowski tested over 100 candlestick patterns across thousands of historical trades to measure their actual predictive reliability rather than relying on anecdotal performance claims.
One of Bulkowski's key findings: bullish engulfing patterns with above-average volume near support had a bullish continuation rate exceeding 63% in his sample. His approach emphasizes pattern confirmation, trend context, and volume as the three filters that separate high-probability setups from low-probability noise. This is the framework for your assignment.
Your Assignment: The Bulkowski Confirmation Method
Start by resetting your Game History in the Dashboard to clear out any old data.
- Load new charts using the simulator until you find one showing a clear trend (either up or down) with a recent pullback or swing to a prior support or resistance level. Premium users can use chart filters to find specific candlestick patterns, including bullish or bearish engulfing, gaps, hammers, hanging men, and gravestone dojis. Learn more about Premium membership.
- Select a pattern. For this test, choose one of the six highest-reliability patterns from Bulkowski's research: bullish engulfing, bearish engulfing, morning star, hammer at support, shooting star at resistance, or gravestone doji at resistance.
- Check the volume. Add the Volume indicator to your chart. Bulkowski's data suggests prioritizing patterns where volume on the signal candle is at least 10-20% above the recent average. If volume is flat or below average, skip the trade.
- Wait one day for confirmation. Click Next Day and observe how price behaves. For a bullish setup, you want the next session to open flat to higher without violating the low of your signal candle. For bearish setups, the inverse applies.
- Enter the trade. If confirmed, place a market order in the direction of the signal. For long trades, set a stop loss order just below the low of the signal candle. For short trades, set your stop just above the signal candle high.
- Set a target. Use the nearest visible resistance level (for longs) or support level (for shorts) as your initial price target.
- Review your results. After 20 trades, open your Dashboard to see how your results compare to Bulkowski's baseline statistics.
- Start over. Choose another candlestick pattern and repeat the process. Remember to record your results and clear your Trade history.
The goal isn't to win every trade. It's to practice reading context, waiting for confirmation, and managing risk consistently. Run this experiment across 20 charts, recording your observations in the Notes section of the simulator. Review your statistics in the Dashboard. Do this for several candlestick patterns and then compare the results to see which you can identify and trade the best.
Free Cash-Prize Touraments
We run free cash-prize tournaments (no entry fee required) when we go live on YouTube. Be sure to subscribe to our channel - @TradingBlitzSimulator - to get alerted when we go live next.
Citations
- Bulkowski, T. N. (2008). Encyclopedia of Candlestick Charts. John Wiley and Sons.
- Nison, S. (1991). Japanese Candlestick Charting Techniques. New York Institute of Finance.
- CMT Association. (2019). CMT Level I Curriculum: An Introduction to Technical Analysis. Wiley.
- Homma, M. (attributed). Historical trading records referenced in Nison (1991).
Disclaimer: Trading involves substantial risk of loss and is not appropriate for all investors. The information provided on Trading Blitz is for educational and informational purposes only. Nothing on this platform, including this article, constitutes financial advice, investment advice, or a recommendation to buy or sell any security. Simulated trading results do not guarantee or predict future performance in live markets. Past performance, whether real or simulated, is not indicative of future results. Always consult a qualified financial professional before making any investment decisions. For additional information, please see our Terms of Service.
Affiliate Disclosure: Some links in this article may be affiliate links. If you click through and make a purchase, Trading Blitz may earn a small commission at no additional cost to you. We only reference tools and resources we believe are relevant to traders.