The Moving Average Convergence and Divergence indicator, better known as MACD, is one of the most widely used tools in technical analysis. Gerald Appel developed it in the late 1970s, and it has remained a staple of trader toolkits ever since. Why? Because it does something genuinely useful: it takes the relationship between two moving averages and turns it into a readable signal about momentum, trend direction, and potential reversals.
By the end of this article, you'll understand how MACD is calculated, what its components actually mean, how to spot high-probability trade setups using it, and how to practice those setups without risking a dime.
What Is MACD and How Does It Work?
MACD is a momentum oscillator built from three components:
- The MACD Line: The difference between a 12-period Exponential Moving Average (EMA) and a 26-period EMA. When the faster EMA (12) is above the slower one (26), the MACD line is positive. When it's below, it's negative.
- The Signal Line: A 9-period EMA of the MACD line itself. Think of it as a smoothed version of the MACD line.
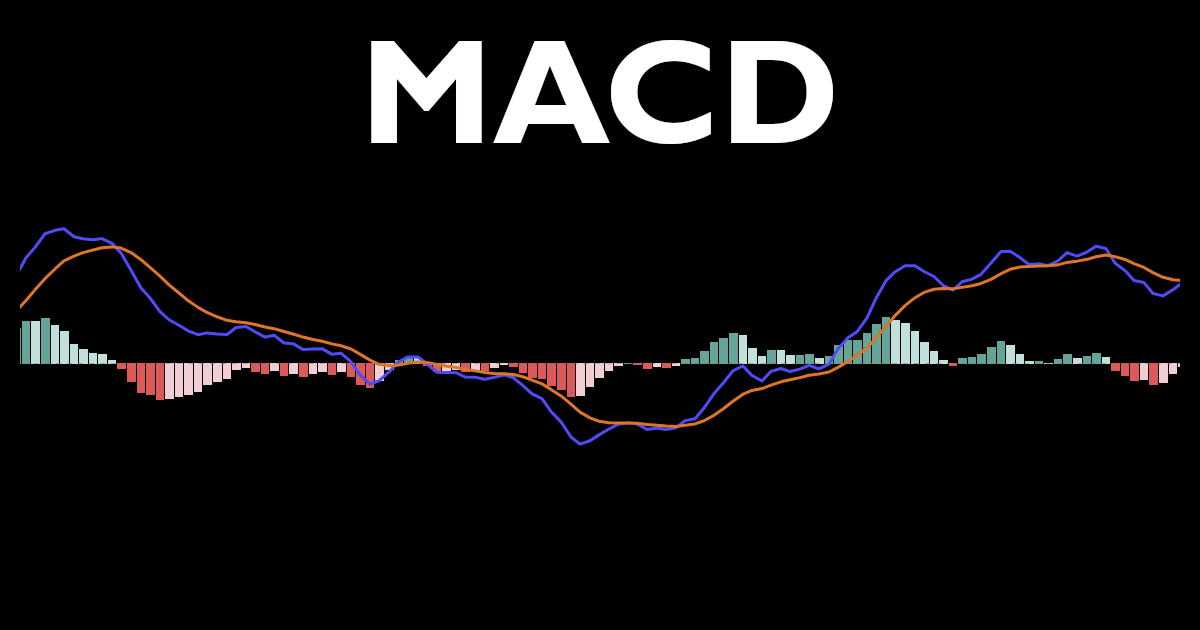
- The Histogram: The visual difference between the MACD line and the Signal line. Expanding bars indicate growing momentum; shrinking bars signal that momentum is fading.

The default settings (12, 26, 9) were designed for daily charts and remain the most commonly used configuration across retail and institutional platforms. Most professional trading desks still reference these defaults because consistency across market participants creates self-reinforcing signals. When enough people are watching the same indicator, its signals gain weight.
How To Read MACD Crossovers and What They Signal
The most basic MACD signal is the crossover. When the MACD line crosses above the signal line, it's considered a bullish crossover and momentum is shifting to the upside. When it crosses below, you've got a bearish crossover.
Here's where retail and institutional mindsets diverge. A retail trader might see a bullish crossover and immediately enter a long trade. An institutional trader is asking a different question: where did this crossover happen? A bullish crossover that occurs below the zero line means price is still in a broader downtrend. Momentum is improving, but you're not out of the woods yet. A bullish crossover above zero, on the other hand, occurs while the trend is already bullish. That's a continuation signal with far more reliability behind it.
According to a 2020 analysis published in the Journal of Financial Economics, trend-following signals generated in the direction of the primary trend outperform counter-trend signals by a statistically significant margin across multiple asset classes. MACD crossovers are no exception to this rule.
How To Spot MACD Divergence Before a Reversal Happens
Divergence is where MACD gets genuinely powerful, and genuinely tricky. Divergence occurs when price and the MACD indicator are moving in opposite directions.
- Bullish Divergence: Price makes a lower low, but the MACD histogram makes a higher low. Selling pressure is weakening even as price continues to fall. This often precedes a reversal to the upside.
- Bearish Divergence: Price makes a higher high, but the MACD histogram makes a lower high. Buying pressure is drying up even though price is still climbing. A reversal downward may follow.

Why does divergence work? Think about the mechanics. If a stock makes a new price high, but the momentum indicator fails to confirm that high, it means fewer buyers are participating in the push. Institutions are often quietly reducing exposure while retail sentiment remains euphoric. The price can only go so far without sustained buying pressure to support it. The histogram captures this imbalance before price fully reflects it.
That said, divergence is not a standalone signal. It identifies a condition, not a precise entry point. Many traders have blown up accounts fading a trend because they spotted divergence too early. The smartest approach is to wait for a MACD crossover to confirm the divergence before acting on it.
3 Common Mistakes Traders Make With MACD
- Using MACD in choppy, sideways markets. MACD is a trend-following tool at heart. In a range-bound market, it generates frequent crossovers that whipsaw traders in both directions. Always assess the broader trend context before relying on MACD signals. If price has been stuck in a tight range for weeks, MACD becomes noisy and unreliable.
- Ignoring the zero line. The zero line is the dividing line between bullish and bearish momentum regimes. Crossovers below zero during a downtrend are traps. Crossovers above zero during an uptrend are opportunities. Context is everything.
- Treating every histogram shrink as a reversal signal. The histogram shrinks anytime momentum slows, even slightly. A consolidation within an uptrend will cause the histogram to compress without leading to any reversal at all. Patience is required before acting on histogram compression alone.
How Gerald Appel Actually Recommended Using MACD
Appel himself outlined a dual-timeframe approach in his book Technical Analysis: Power Tools for Active Investors (2005). He recommended using a longer-period MACD to confirm the overall trend direction, then using the standard MACD to time entries. On daily charts, he favored taking long positions only when the longer-period MACD confirmed a bullish trend, and then entering on bullish crossovers of the standard MACD. This filtered out a substantial number of false signals that plagued single-indicator strategies.
He also noted that MACD divergence on weekly charts carried significantly more weight than daily divergence, a reminder that context and timeframe always influence signal quality.

How To Practice MACD Trading Strategies on the Simulator
The following assignment is based on Gerald Appel's dual-confirmation MACD approach, adapted for the Trading Blitz daily chart simulator.
Your Assignment: The Appel MACD Confirmation Strategy
Rest Game History: Before you begin, reset your Game History in your Dashboard to ensure you aren't including any old data in your results.
Setup: Add two MACD indicators to your chart in the simulator. Set the first to standard settings (12, 26, 9). Set the second to slower settings (50, 200, 9) to represent the longer-trend MACD Appel described.
Rules for a Long Trade:
- The slow MACD (50, 200, 9) must have its MACD line above the zero line, confirming a bullish trend environment.
- Wait for the standard MACD (12, 26, 9) to produce a bullish crossover, the MACD line crosses above the signal line.
- Enter a long position using a market order on the day the crossover is confirmed.
- Place a stop loss order below the most recent swing low on the chart.
- Exit when the standard MACD produces a bearish crossover, or when your stop loss is triggered.
Rules for a Short Trade:
- The slow MACD (50, 200, 9) must have its MACD line below the zero line, confirming a bearish trend environment.
- Wait for the standard MACD (12, 26, 9) to produce a bearish crossover.
- Enter a short position using a market order.
- Place a stop loss above the most recent swing high.
- Exit on a bullish crossover of the standard MACD or when stopped out.
Tracking Your Results: Run at least 20 trades and review your win rate, profit factor, and average holding period in your dashboard. Pay specific attention to how your results change when you honor the slow MACD filter versus when you ignore it. Most traders find that this single filter dramatically reduces losing trades in trending conditions.
Modifications: Try experimenting with different EMA lengths for the long-term MACD (e.g. 19, 39,9 or 20,100,9) and see which produces better results for you.
Premium users can filter for MACD crossover or MACD crossunder charts to load setups that are already at or near a signal point, which is a great way to accelerate your repetitions.
Free Cash-Prize Touraments
We run free cash-prize tournaments (no entry fee required) when we go live on YouTube. Be sure to subscribe to our channel - @TradingBlitzSimulator - to get alerted when we go live next.
Citations
- Appel, G. (2005). Technical Analysis: Power Tools for Active Investors. Financial Times Prentice Hall.
- Jegadeesh, N., & Titman, S. (2020). "Momentum: Evidence and Insights." Journal of Financial Economics.
Disclaimer: Trading involves substantial risk of loss and is not appropriate for all investors. The information provided on Trading Blitz is for educational and informational purposes only. Nothing on this platform, including this article, constitutes financial advice, investment advice, or a recommendation to buy or sell any security. Simulated trading results do not guarantee or predict future performance in live markets. Past performance, whether real or simulated, is not indicative of future results. Always consult a qualified financial professional before making any investment decisions. For additional information, please see our Terms of Service.
Affiliate Disclosure: Some links in this article may be affiliate links. If you click through and make a purchase, Trading Blitz may earn a small commission at no additional cost to you. We only reference tools and resources we believe are relevant to traders.