Price tells you what the market is doing. Volume tells you whether anyone actually believes it. That distinction matters more than most beginners realize, and mastering volume analysis is one of the fastest ways to filter out false signals and start reading charts with real conviction.
Volume is simply the number of shares traded during a given period. On a daily chart, it represents every share that changed hands that day. But the raw number means almost nothing in isolation. What matters is how volume behaves relative to price movement, and what that relationship reveals about the intentions of the people moving serious money.
What Is Volume Analysis and Why Does It Matter for Traders?
Think of price action as a story and volume as the emotion behind it. A stock rallying on heavy volume is a crowd sprinting toward the exit of a building, there's urgency, conviction, and follow-through. A stock rallying on thin volume is more like a slow shuffle. It might keep moving, but there's no real fuel behind it.
According to Investopedia, volume is one of the most widely tracked indicators in technical analysis, and for good reason: it's one of the few truly objective data points available. Price can be manipulated in thin markets. Volume is harder to fake because it reflects actual transactions between real buyers and sellers.
The core principle is this: volume confirms price. When price moves in one direction and volume supports that move, the trend is more likely to continue. When price moves but volume is absent, the move is suspect and more likely to reverse.
How To Identify High-Volume Breakouts vs. False Breakouts
One of the most practical applications of volume analysis is distinguishing real breakouts from fakeouts. This is a problem that costs traders a tremendous amount of money. A stock breaks above a resistance level, you enter, and then it immediately reverses. Sound familiar?
Here's why fakeouts happen: institutional traders and algorithms are well aware of where retail stop orders and breakout entries cluster. Resistance levels are obvious to everyone. A brief push above that level can trigger a wave of retail buy orders, which institutions then sell into. Without volume confirmation, you're often the liquidity that professionals are unloading shares to.

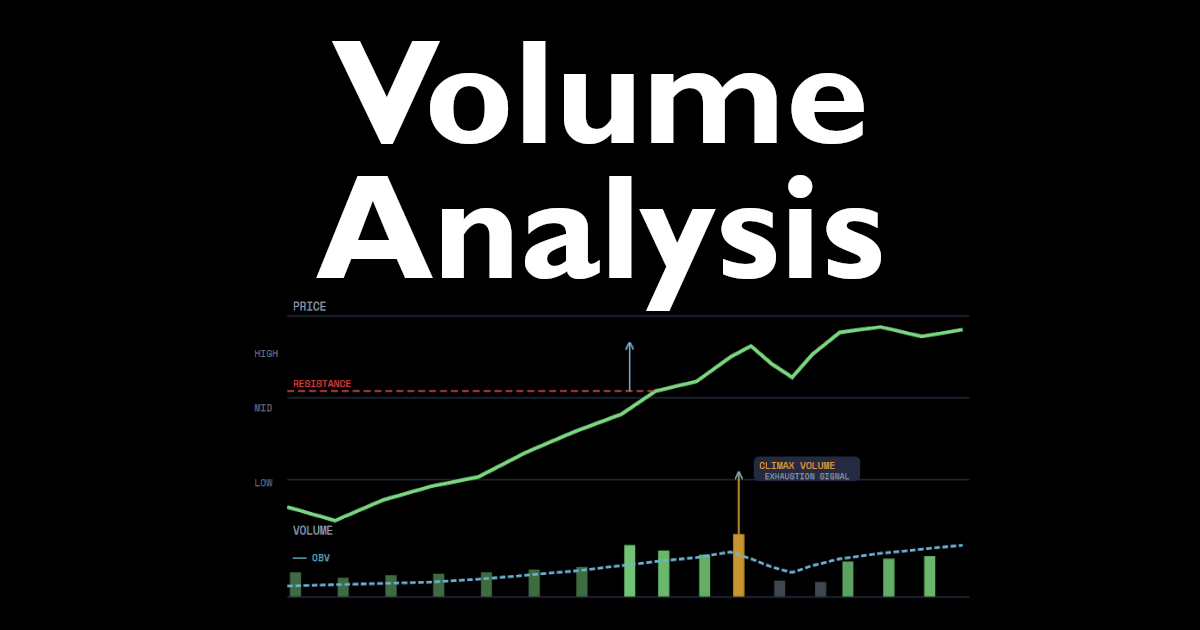
A genuine breakout typically shows volume at least 50% above the 20-day average on the breakout day. The logic is straightforward: if big institutions are genuinely repositioning into a stock, the sheer size of their orders will produce measurable volume. You can't quietly move 500,000 shares.
A weak-volume breakout, by contrast, often reflects retail enthusiasm without institutional participation. No institutional fuel means no sustained follow-through.
3 Volume Patterns Every Trader Should Recognize
1. Volume Expansion on Trend Days
When a stock makes a strong directional move and volume is expanding day over day, that's trend confirmation. The market is saying the move has broad participation. This is healthy trend behavior and supports holding positions or even adding to them.
2. Volume Climax (Exhaustion Volume)
Sometimes volume spikes dramatically at the end of a long trend. This is called a climax volume event, and it often marks a turning point. Why? Because a parabolic spike in volume means every willing buyer (in an uptrend) has now bought. When there are no more buyers left, sellers take control. This pattern is a textbook warning sign to consider reducing long exposure.
3. Volume Divergence
Price makes a new high, but volume is lower than it was on the previous high. This is a divergence, and it's one of the more reliable warning signals in technical analysis. The market is technically advancing, but fewer people are participating. It suggests the move is running out of steam, even before price confirms the reversal.

What Is On-Balance Volume (OBV) and How To Use It Effectively
On-Balance Volume, or OBV, was developed by Joseph Granville in the 1960s and introduced in his 1963 book Granville's New Key to Stock Market Profits. It's a cumulative indicator that adds volume on up days and subtracts it on down days. The result is a running total that reflects whether volume is flowing into or out of a stock.
The real power of OBV is in comparing its trend to price. If price is trending higher and OBV is also trending higher, that's confirmation. If price is rising but OBV is flat or falling, that's a red flag — the institutional money may not be supporting the rally. Granville's insight was that volume precedes price, meaning OBV often turns before price does, giving traders an early warning.
OBV is available in most charting platforms, including TradingView, which powers the Trading Blitz simulator.
How Institutional Money Flow Drives Volume Patterns
Retail traders trade in hundreds or low thousands of shares. Institutions trade in hundreds of thousands, sometimes millions. Because they can't enter or exit positions quickly without moving the market against themselves, they spread their activity over days or weeks. This is why volume often builds gradually during accumulation phases before a major breakout — institutions are quietly buying before the crowd notices.
This is also why low-volume pullbacks within an uptrend are bullish. When a stock dips back toward support on light volume, it suggests institutions aren't selling. They're simply allowing the stock to drift back to a better price level before the next leg higher. Compare that to a sharp pullback on heavy volume, which signals genuine selling pressure and a potential trend reversal.
Understanding this dynamic changes how you read charts. Volume becomes a window into what the "smart money" is actually doing, as opposed to what price alone might suggest.
How To Practice Volume Analysis With OBV on the Simulator
This assignment is based on the OBV Trend Confirmation Strategy, a method rooted in Granville's original work and widely used by professional technical analysts. The goal is to practice entering trades only when price action and OBV are in agreement, and avoiding trades when they diverge.
Setup:
- Clear your Game History to ensure you don't have any old data in your test results.
- Load a new chart on Trading Blitz. Add the On-Balance Volume (OBV) indicator from the TradingView indicator menu.
- Spend time loading new charts until you find one showing a clear uptrend or downtrend in price over the visible history.
- Before advancing any days, examine whether OBV is trending in the same direction as price. Confirmed alignment is your green light. Divergence is your warning to stand aside or watch carefully.
Trade Rules:
- Long Entry: Price pulls back to a moving average or prior support area, and OBV has held firm or continued higher during the pullback. Enter long with a market order on the next day.
- Short Entry: Price rallies into resistance but OBV has been declining. This divergence suggests distribution. Enter short when price stalls at resistance.
- Stop Loss: Place a stop loss below the recent swing low for longs, or above the recent swing high for shorts. Keep risk to roughly 2% of your virtual account per trade.
- Exit: Exit when OBV diverges against your position, or when price reaches the next significant support/resistance level.
What to track: After each trade, note whether OBV confirmed your entry direction or if you ignored a divergence. Over 10 to 20 trades, review how often confirmed OBV alignment produced profitable results compared to trades taken without it. This is the kind of repetitive, deliberate practice that builds real pattern recognition over time.
If you're a premium member, use the Breakout or Pullback chart filters to target setups where volume confirmation is especially meaningful.
Free Cash-Prize Touraments
We run free cash-prize tournaments (no entry fee required) when we go live on YouTube. Be sure to subscribe to our channel - @TradingBlitzSimulator - to get alerted when we go live next.
Citations
- Granville, J. (1963). Granville's New Key to Stock Market Profits. Prentice-Hall.
- Murphy, J.J. (1999). Technical Analysis of the Financial Markets. New York Institute of Finance.
- Investopedia. "Volume Analysis." Investopedia.com.
- CMT Association. CMT Curriculum, Level I: An Introduction to Technical Analysis.
Disclaimer: Trading involves substantial risk of loss and is not appropriate for all investors. The information provided on Trading Blitz is for educational and informational purposes only. Nothing on this platform, including this article, constitutes financial advice, investment advice, or a recommendation to buy or sell any security. Simulated trading results do not guarantee or predict future performance in live markets. Past performance, whether real or simulated, is not indicative of future results. Always consult a qualified financial professional before making any investment decisions. For additional information, please see our Terms of Service.
Affiliate Disclosure: Some links in this article may be affiliate links. If you click through and make a purchase, Trading Blitz may earn a small commission at no additional cost to you. We only reference tools and resources we believe are relevant to traders.