Support and resistance are the foundation of technical analysis. Every chart pattern, every breakout, and every failed rally come back to these two concepts. If you can read support and resistance well, you can read charts. Period. This article breaks down what these levels are, why they form, and how to actually trade them with a strategy backed by one of the most respected names in technical trading.
What Is Support and Resistance and Why Does It Matter?
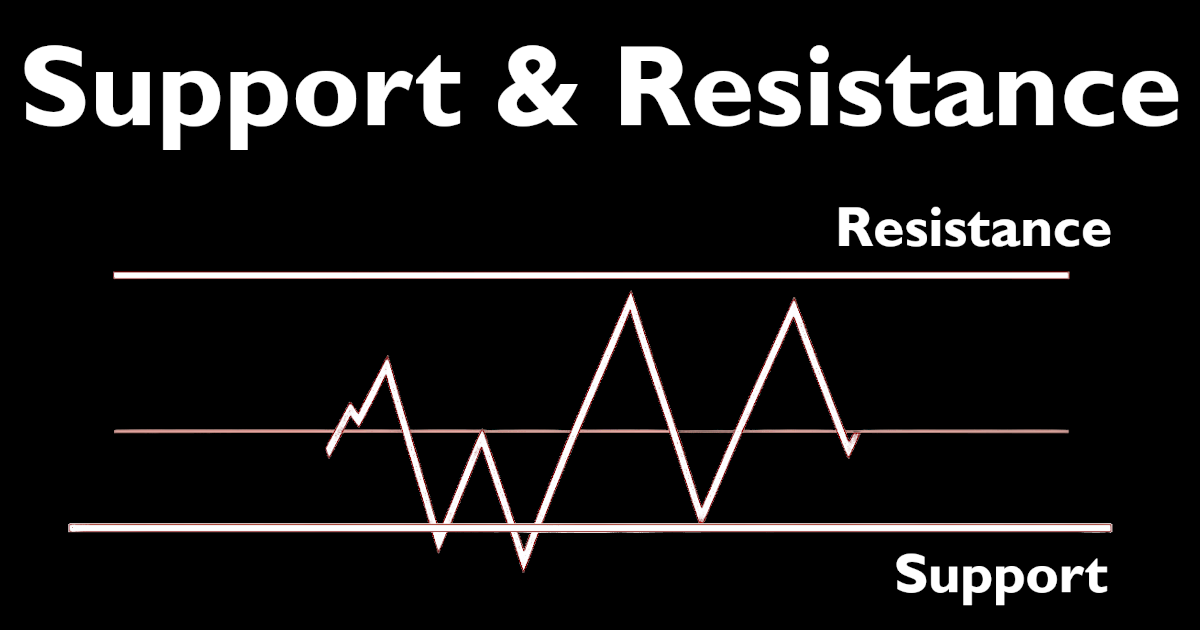
Support is a price level where buying pressure is strong enough to stop a decline and push prices back up. Resistance is the opposite. It's a price ceiling where selling pressure overwhelms buyers and stalls an advance. These aren't arbitrary lines drawn on a chart. They're the physical footprints of real money, institutional orders, retail stop clusters, and algorithmic triggers all converging at the same price zones, repeatedly.
Here's the key insight that most beginners miss: price doesn't just randomly bounce. There's a structured reason why $50 stops a selloff three times in a row. Understanding why requires understanding how markets actually work at the participant level.
Why Support and Resistance Levels Form: The Market Psychology Behind the Zones
Three types of traders create support and resistance levels, and they do it at the same price zones for very different reasons:
- Traders who missed the move: If a stock bounces hard off $40 and you missed it, this trader waits and hopes it will come back to $40 in order to get in. When thousands of traders do this simultaneously, it creates a cluster of buy orders right at that support level.
- Traders who got in at the wrong time: Buyers who bought at resistance and watched the stock fall are now trapped. When price climbs back to their entry, they sell to "break even." This creates natural selling pressure at the same level it failed before.
- Institutional algorithms: Large funds and market makers set limit orders at round numbers and historically significant price zones. A $100 stock often has more institutional order flow at exactly $100 than at $97.43. These orders are large enough to create visible bounces on daily charts.
The result is self-reinforcing. The more traders watch a level, the more order flow collects there, and the more reliable the level becomes. This is why well-established support and resistance levels on widely-followed stocks tend to hold more consistently than obscure ones.

How To Identify Strong Support and Resistance Levels on a Chart
Not all levels are created equal. A price zone that has been tested five times carries significantly more weight than one that has only been touched twice. Here's how we can rank the strength of a level:
- Number of touches: More tests, more validity. A level tested three or more times is considered well-established.
- Volume at the level: High-volume reversals at a price zone confirm that meaningful participation occurred there. A bounce on light volume is less convincing.
- Time between touches: A support level that has held up over six months is more meaningful than one that formed over three weeks. Time increases the number of market participants who have positioned around it.
- How price left the zone: A sharp, fast rejection from a level, especially with a long wick candle, signals aggressive order flow defending that price. A slow grind through a zone is less definitive.
How Support Becomes Resistance (and Vice Versa)
One of the most powerful and reliable concepts in all of technical analysis is role reversal. When a support level breaks convincingly, it flips and becomes resistance on any subsequent bounce back up to that level. The logic is straightforward: traders who were long at the support level are now underwater. When price bounces back up to their entry, they exit to recover losses and break even, creating selling pressure at exactly the same level that used to attract buyers.
This flip happens consistently enough that many traders build entire strategies around it. Look for a clean break of a multi-touch support level, followed by a retest of that same level from below. A failure to break back above it, especially with a bearish candle pattern on the retest, can be a high-probability short entry.

3 Common Mistakes Traders Make With Support and Resistance Levels
- Treating levels as exact lines instead of zones: Price rarely turns on a dime at a precise number. Think of support and resistance as zones spanning a few percent around a key level, not a single penny-precise line.
- Ignoring the broader trend: Support in a downtrend breaks more often than support in an uptrend. A level is only as strong as the trend context around it. Trading bounces in a strong downtrend is a quick way to burn through capital.
- Failing to update levels as the chart develops: New price action creates new levels. A chart from six months ago needs to be re-evaluated with current data. Static analysis leads to missed shifts in market structure.
A Professional Strategy: The Demand Zone Bounce Method by Sam Seiden
Sam Seiden, a former Chicago Mercantile Exchange floor trader and widely cited supply and demand educator, developed a framework for identifying high-probability support entries based on institutional order flow. His approach, often called Supply and Demand Zone Trading, focuses on identifying the exact price zones where large institutions placed their initial orders, then entering when price returns to those zones.
Seiden's core argument, backed by his floor trading experience, is that institutions cannot fill large orders all at once without moving price against themselves. So they leave unfilled orders behind at specific price levels. When price revisits those zones, the remaining institutional orders kick in and create a reliable move. According to Seiden, the sharpest and fastest departures from a price level indicate the largest concentration of unfilled orders.
Seiden identifies a "demand zone" by looking for a price area where the stock made a sharp, strong rally away from a base, particularly after a period of consolidation. The zone is defined by the range of that base. The entry is placed when price returns to that zone with a limit order, and the stop is placed just below the bottom of the zone.
How To Practice the Demand Zone Bounce Strategy on the Simulator
This assignment puts Seiden's demand zone concept into practice using the Trading Blitz simulator. Here's exactly how to run it:
- Reset your Game History (Dashboard) to ensure you are not including any old data in your test results.
- Load new charts until you find a clean setup. You're looking for a chart where price made a sharp, explosive rally away from a tight consolidation base at some point in the visible history. The sharper the rally, the better the demand zone. Premium users can filter by the Breakout pattern to find charts where this type of move has recently occurred.
- Define the demand zone. Mark the price range of the consolidation base that preceded the sharp rally. The bottom of that range is your stop level. The top of the range is your entry trigger.
- Target the prior high (Reward-to-Risk). Evaluate the potential trade by measuring the previous swing high (target price) above the demand zone, and compare this to the height of the demand zone (stop loss). Aim for a reward-to-risk ratio of at least 2:1 before taking the trade.
- Wait for a pullback into the zone. If the reward-to-risk makes sense, then use the Next Day button to advance the chart to see if the stock returns to the demand zone. Do not enter early. If the price pulls back toward the top of the demand zone, place a limit order either just above or inside the damand zone.
- Long entered at the zone. Now, enter a stop. If the order executes, enter a stop loss just below the bottom of the zone. Your risk is the height of the demand zone. Reward-to-Risk = (Prior Swing High - Entry Price) / (Entry Price - Bottom of Demand Zone)
- Log your results. Find ten to twenty trades using this setup, record your notes in the simulator, and then review your win rate and profit factor on the dashboard. If your results have a profit factor above 1.5 over a sample size of at least twenty trades, then your strategy likely has an edge and merits further investigation.
The simulator's anonymized charts are ideal for this exercise because you're forced to make decisions based purely on price structure — no ticker bias, no news headlines, no analyst ratings. Just the zone and the price action.
Free Cash-Prize Touraments
We run free cash-prize tournaments (no entry fee required) when we go live on YouTube. Be sure to subscribe to our channel - @TradingBlitzSimulator - to get alerted when we go live next.
Citations
- Seiden, S. (2012). Online Trading Academy: Supply and Demand Course Materials. Online Trading Academy.
- Murphy, J.J. (1999). Technical Analysis of the Financial Markets. New York Institute of Finance. pp. 59–98. (Buy on Amazon)
- Schwager, J.D. (1993). The New Market Wizards. HarperCollins. (Referenced for institutional order flow behavior discussion.) (Buy on Amazon)
Disclaimer
Trading involves substantial risk of loss and is not appropriate for all investors. Past performance — whether in live markets or in a simulator — is not indicative of future results. The information provided on Trading Blitz, including this article, is intended solely for educational purposes and does not constitute financial advice, investment advice, or a recommendation to buy or sell any security. You should consult a qualified financial professional before making any investment decisions. For additional information, please see our Terms of Service.
Affiliate Disclosure: Some links in this article may be affiliate links. If you click through and make a purchase, Trading Blitz may earn a small commission at no additional cost to you. We only reference tools and resources we believe are relevant to traders.