Triangle patterns are among the most reliable and widely studied formations in technical analysis. They show up constantly across all market conditions, and once you learn to spot them, you'll wonder how you ever read a chart without them. Whether the market is trending hard or grinding sideways, triangles leave a very specific fingerprint, one that tells you a confrontation between buyers and sellers is reaching its breaking point.
This article covers all three major triangle types: ascending, descending, and symmetrical. You'll learn what each one looks like, why they form, who's winning the tug-of-war inside them, and how to trade the eventual breakout with confidence.
What Is a Triangle Pattern and Why Does It Form?
A triangle is a consolidation pattern where price makes a series of lower highs and/or higher lows, converging toward an apex. The pattern reflects a temporary standoff between buyers and sellers. Volume typically contracts during the formation, which is itself a clue: the market is coiling, compressing energy that eventually releases in a directional move.

From an institutional standpoint, large players often use these consolidation phases to accumulate or distribute positions without dramatically moving the market. Retail traders, meanwhile, frequently get chopped up trading inside the triangle, buying highs and selling lows, while the real move is still being prepared. Understanding this dynamic gives you a significant edge. Your job is to wait for the breakout, not fight the noise inside the pattern.
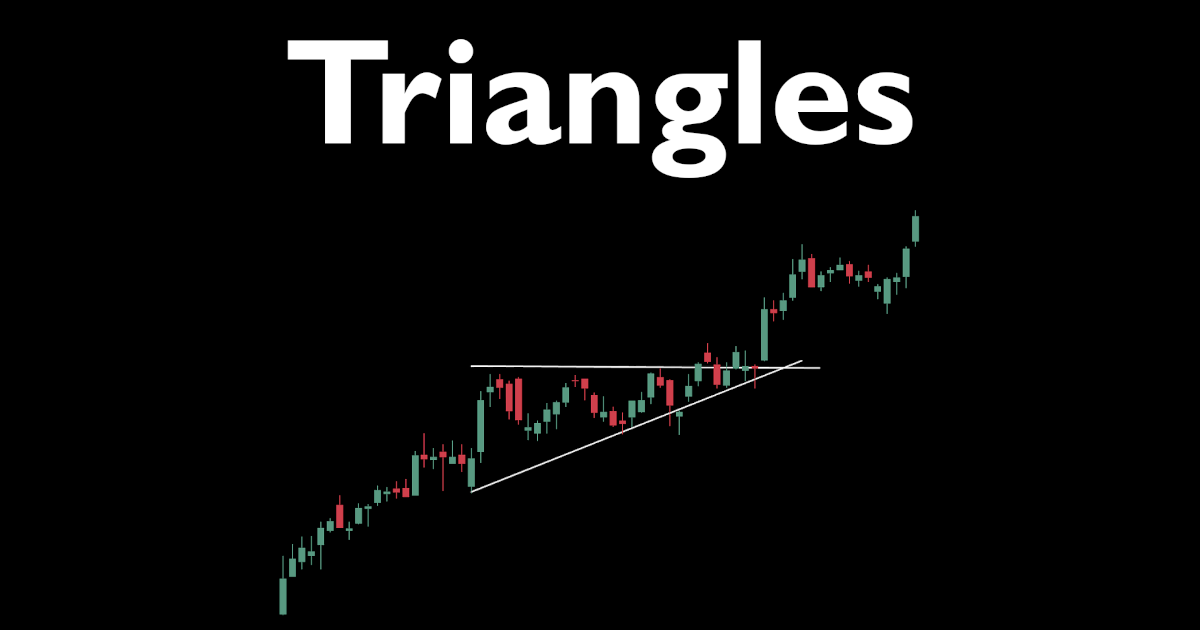
How To Identify an Ascending Triangle Pattern
The ascending triangle has a flat upper trendline and a rising lower trendline. Price keeps making higher lows, meaning buyers are getting progressively more aggressive. They're willing to step in earlier and earlier. The flat top represents a supply zone where sellers have been defending a specific price level. Every time price reaches that ceiling, sellers unload. But with each pullback, buyers absorb more of that selling pressure.
This is a classic standoff with a clear directional lean: buyers are winning. Each test of resistance chips away at the remaining supply. Eventually, there aren't enough sellers left to hold the line, and price breaks above the flat resistance with a surge in volume.
- Trend context: Ascending triangles are most powerful when they form after an established uptrend in which the pattern then acts as a continuation signal.
- Breakout direction: Typically ascending triangles break out to the upside, though about 20-25% of them break downward according to Thomas Bulkowski's extensive pattern research in Encyclopedia of Chart Patterns.
- Price target: Measure the height of the triangle at its widest point and project that distance upward from the breakout level.

How To Identify a Descending Triangle Pattern
The descending triangle is the mirror image. It features a flat lower trendline and a declining upper trendline. Sellers are getting more aggressive. They're willing to sell at lower and lower prices, while buyers defend a specific support level repeatedly. The flat bottom is where demand keeps stepping in.
The lean here is clearly bearish. Each lower high tells you that any attempt at a rally is being sold into more aggressively than the last. Buyers at the support floor are taking on more and more selling pressure. When they finally get exhausted, price often breaks down through support rather sharply.
- Trend context: Most powerful after an established downtrend, acting as a continuation signal lower.
- Breakout direction: Typically to the downside. Bulkowski's research found descending triangles break downward roughly 64% of the time.
- Price target: Same method—measure the pattern height at its widest point and project downward from the breakdown level.
How To Identify a Symmetrical Triangle Pattern
The symmetrical triangle has both a declining upper trendline and a rising lower trendline. Neither buyers nor sellers have a clear edge, both are getting less aggressive over time. This is a genuine stalemate, and the market is essentially deferring its decision until forced to make one near the apex.
Because there's no structural lean, symmetrical triangles are considered neutral patterns. The breakout can go either way, which makes them trickier to trade than ascending or descending triangles. However, the general rule of thumb is that symmetrical triangles tend to continue in the direction of the prior trend. If price was heading up before the pattern formed, odds favor an upside breakout.
- Trend context: Pay close attention to the preceding trend. It's your best directional clue.
- Volume behavior: Watch for a volume expansion on the breakout candle. A breakout on thin volume is a red flag and has a higher failure rate.
- Timing: Most technical analysts recommend avoiding entries too close to the apex. Breakouts that occur in the final 25% of the triangle often lack the momentum for a clean follow-through.
3 Rules for Trading Triangle Breakouts Without Getting Faked Out
- Wait for a confirmed close beyond the trendline. Intraday pierces happen all the time. A meaningful breakout needs a daily closing price that's clearly beyond the boundary, not just a wick that kissed the line and retreated.
- Look for volume confirmation. Volume should expand noticeably on the breakout day. If price breaks out on below-average volume, treat it with skepticism and consider waiting for a retest of the broken trendline.
- Place your stop logically, not randomly. For an upside breakout, your stop belongs just below the last higher low or below the broken trendline. Don't set it so tight that normal volatility kicks you out before the move develops.
What Is the Linda Raschke Triangle Trading Strategy?
Linda Bradford Raschke is a professional trader, former hedge fund manager, and founding member of the Market Technicians Association. Her approach to trading triangles, detailed in works like Street Smarts (co-authored with Laurence Connors), focuses on trading symmetrical triangles using a volatility-contraction breakout method combined with momentum confirmation from the MACD indicator.
The core insight of her approach is this: volatility contraction inside a triangle is measurable, and when a breakout occurs with MACD momentum confirming the direction, the probability of a sustained move increases meaningfully. She emphasizes trading the breakout, not predicting it. This is a distinction that keeps traders from the costly mistake of entering prematurely inside the pattern.
Raschke Triangle Breakout Strategy Rules:
- Identify a symmetrical, ascending, or descending triangle where price has made at least two touches on each trendline.
- Add the MACD indicator (standard settings: 12, 26, 9) to your chart.
- Wait for price to close beyond the triangle boundary on above-average volume.
- Confirm that the MACD histogram is expanding in the direction of the breakout (rising for upside breaks, falling for downside breaks) at or just after the breakout candle.
- Enter on the next day's open after both conditions are met — price close outside the triangle AND MACD histogram confirming direction.
- Set your initial stop loss just inside the triangle boundary (roughly 1-2% beyond the trendline in the opposite direction from your entry).
- Use the measured move target (triangle height projected from breakout point) as your profit target, or trail your stop as price moves in your favor.

ASSIGNMENT: Practice the Triangle Breakout Strategy
This is where your real learning happens. Reading about triangles is useful. Trading them in Solo mode, and then again under simulated pressure in both Two-Player mode and our free cash-prize tournaments (no entry fee required) will help build this skill.
Your Assignment:
- Log into Trading Blitz, clear your Game History in the Dashboard, and start a Solo session. If you have a Premium membership, use the Breakout or Breakdown chart filter to load charts that already exhibit this price behavior. This will dramatically speed up your reps.
- Load new charts until you find one where price has recently been forming converging trendlines, two touches on each side minimum. Identify whether it's ascending, descending, or symmetrical.
- Add the MACD indicator to the chart using standard settings (12, 26, 9).
- Begin advancing through the days by clicking Next Day. Watch how price behaves as it approaches the apex. Does volume dry up? Does the MACD histogram flatten?
- Apply Raschke's rules: only enter after a confirmed daily close outside the trendline with MACD histogram expansion confirming the direction. Do not enter early inside the pattern. Treat that as a rule, not a suggestion.
- Record your entry price, stop placement, and target in the Notes section. After you exit, review whether the measured move target was hit and whether the MACD signal held up.
- Complete at least twenty triangle breakout trades across different chart loads and review your trading statistics in the dashboard. If it looks like this strategy gives you an edge, continue testing until you reach 40+ trades. Take notes on each setup. When you finish, review your statistics and notes to draw conclusions about strategy's effectiveness for your style.
The anonymized chart format on Trading Blitz is genuinely useful here. You won't have any memory of how "that stock" performed, so every decision gets made on the pattern itself. That's exactly the discipline you need to build.
Free Cash-Prize Touraments
We run free cash-prize tournaments (no entry fee required) when we go live on YouTube. Be sure to subscribe to our channel - @TradingBlitzSimulator - to get alerted when we go live next.
Citations
- Bulkowski, Thomas N. Encyclopedia of Chart Patterns, 3rd Edition. Wiley, 2021.
- Raschke, Linda Bradford, and Laurence A. Connors. Street Smarts: High Probability Short-Term Trading Strategies. M. Gordon Publishing, 1996.
- Murphy, John J. Technical Analysis of the Financial Markets. New York Institute of Finance, 1999.
Disclaimer: Trading Blitz is a simulation platform intended for educational purposes only. All content on Trading Blitz, including articles, trade signals, and simulator results, is provided for informational and educational use and does not constitute financial advice, investment advice, or a recommendation to buy or sell any security. Trading stocks and other financial instruments involves substantial risk of loss and is not appropriate for all investors. Past performance in the simulator does not guarantee future results in live markets. Always conduct your own research and consult a qualified financial professional before making any investment decisions. For additional information, please see our Terms of Service.