Flag and pennant patterns are among the most reliable continuation patterns in technical analysis. They show up constantly across all market conditions, they're visually distinct once you know what to look for, and they carry a built-in logic that makes them more than just a pretty shape on a chart. If you want to catch the second leg of a powerful move, learning to spot these patterns accurately is one of the most practical skills you can build.
This article breaks down exactly what these patterns are, why they form, and how to trade them with a structured approach.
What Are Flag and Pennant Patterns and How Do They Form?
Both flags and pennants are short-term consolidation patterns that appear after a sharp, almost vertical price move called the flagpole. The flagpole is the initial surge, and it matters a lot. Without a strong flagpole, the pattern often loses its predictive punch.
After the flagpole, the price doesn't just keep sprinting. It pauses to catch its breath. This consolidation phase is where the flag or pennant forms, and the distinction between the two comes down to shape:
- Flag: The consolidation forms a tight, rectangular channel that slopes against the prior trend. In a bull flag, price drifts slightly downward in a parallel channel. In a bear flag, it drifts upward.
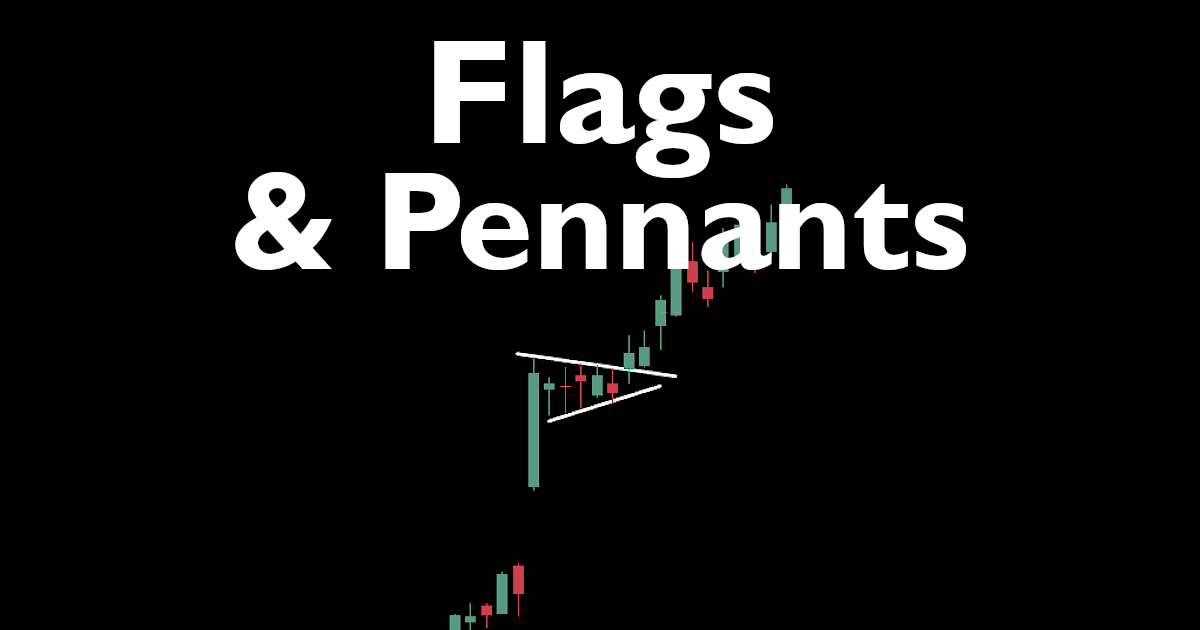
- Pennant: The consolidation forms a small symmetrical triangle, with converging trendlines as the price action tightens. Volume typically contracts during this phase, coiling energy before the next move.
Both patterns resolve with a breakout in the direction of the original flagpole move. That's the thesis, at least. Volume is your confirmation signal.

Why Do Flag and Pennant Patterns Actually Work?
This is where most beginner resources stop short. Pattern recognition without understanding the underlying forces is just memorization. So why do these patterns repeat across markets and time periods?
The flagpole represents a surge of aggressive buying (or selling). Think of it as a crowd of traders all rushing through the same door at once. Momentum traders, breakout algorithms, and institutional accumulation programs all pile in simultaneously. The move is fast and often news-driven or catalyzed by a technical breakout from a prior base.
Then the initial surge fades. Early buyers take partial profits. Short sellers attempt to fade the move. Retail traders who missed the first leg wait nervously on the sidelines. This is what creates the consolidation. The flagpole buyers are sitting on gains and holding. The sellers can't push price significantly lower because demand is still present beneath the surface. The result is a tight, organized pullback rather than a full reversal.
On the institutional side, large funds that couldn't fill their entire position during the initial spike use this consolidation window to add to positions quietly, without pushing price back up too fast. Algorithms programmed to accumulate a specific number of shares over time continue working their orders in the background. This steady, methodical accumulation is what keeps the consolidation tight and orderly.
When the selling pressure is finally exhausted, the trapped shorts cover, the sideline crowd jumps in, and the institutional buyers complete their accumulation. Price breaks out, and the second leg begins. That's the mechanical story behind why these patterns work.
How To Measure a Price Target Using the Flagpole Method
One of the more useful features of flag and pennant patterns is the built-in price target measurement. The most commonly used method is simply projecting the length of the flagpole from the breakout point.
- Measure the length of the flagpole from the base of the move to the high (for a bull flag).
- Add that distance to the breakout point of the flag or pennant.
- That gives you a rough price target for the continuation move.
According to Thomas Bulkowski's extensive pattern research published in Encyclopedia of Chart Patterns, bull flags meet their price targets roughly 64% of the time, while pennants perform similarly at about 54% for upward breakouts. These aren't guarantees, but they're odds that are meaningful when combined with solid risk management.
3 Key Rules To Avoid False Breakouts in Flag Patterns
False breakouts are the biggest hazard with these patterns. Here's how to filter out the noise and focus on the setups that are most likely to follow through:
- Require a strong flagpole. The initial move should be sharp and impulsive, not gradual. A weak drift upward doesn't qualify. You want a move of at least 10-15% in a short time frame, ideally on above-average volume.
- Watch for volume contraction during consolidation. Volume should dry up as the flag or pennant forms. Expanding volume during the consolidation suggests distribution, not healthy digestion of gains.
- Demand a volume surge on the breakout. The breakout bar should come with a noticeable spike in volume. A quiet breakout on thin volume has a much higher failure rate. This is the crowd finally committing.

How To Practice Trading Flag and Pennant Patterns
The strategy below is adapted from the approach used by Brian Shannon, CMT, founder of Alphatrends.net and author of Technical Analysis Using Multiple Timeframes. Shannon is well-known for his disciplined application of volume analysis and VWAP-based entries, but the core of his flag trading methodology can be adapted cleanly to daily chart practice.
The Assignment: Brian Shannon's Flag Breakout Method
Objective: Identify high-quality bull flag setups and practice entering on confirmed breakouts with defined risk.
Setup Rules:
- Load new charts until you find one where a sharp, multi-day surge was followed by a tight, low-volume consolidation of 5 to 15 bars. The consolidation should slope slightly downward or move sideways, not erratically.
- The consolidation should form either a parallel channel (flag) or a converging triangle (pennant).
- Use the Volume indicator to confirm that volume contracted during the consolidation phase relative to the flagpole.
- If you have a premium account, use the Breakout filter to be served charts with recent breakout activity, which will often surface post-flagpole situations worth evaluating.
Entry Rules:
- Place an order just above the upper trendline of the flag or pennant. Wait for price to come to you on the breakout day.
Stop Loss:
- Place your stop loss below the lowest point of the flag or pennant consolidation. A close below this level invalidates the pattern.
Target:
- Measure the flagpole length and project it from your entry point. Mark that level and consider taking partial profits there.
Tracking:
- After each trade, record your observations in the simulator Notes section. Ask yourself: Was the flagpole strong enough? Did volume confirm the breakout? How far did price travel before stalling? After 20 trades using this method, review your statistics and look for patterns in your wins and losses. That feedback loop is where real skill develops.
The simulator is perfectly designed for this kind of deliberate practice. You advance one day at a time, which forces you to make a real decision at each bar rather than just watching the outcome passively. That pressure is the point.
Free Cash-Prize Touraments
We run free cash-prize tournaments (no entry fee required) when we go live on YouTube. Be sure to subscribe to our channel - @TradingBlitzSimulator - to get alerted when we go live next.
Citations
- Bulkowski, Thomas N. Encyclopedia of Chart Patterns, 3rd Edition. Wiley, 2021.
- Shannon, Brian. Technical Analysis Using Multiple Timeframes. LifeVest Publishing, 2008.
- Murphy, John J. Technical Analysis of the Financial Markets. New York Institute of Finance, 1999.
Disclaimer: Trading involves substantial risk of loss and is not appropriate for all investors. The information provided on Trading Blitz is for educational and informational purposes only. Nothing on this platform, including this article, constitutes financial advice, investment advice, or a recommendation to buy or sell any security. Simulated trading results do not guarantee or predict future performance in live markets. Past performance, whether real or simulated, is not indicative of future results. Always consult a qualified financial professional before making any investment decisions. For additional information, please see our Terms of Service.
Affiliate Disclosure: Some links in this article may be affiliate links. If you click through and make a purchase, Trading Blitz may earn a small commission at no additional cost to you. We only reference tools and resources we believe are relevant to traders.