Most new traders obsess over finding the perfect entry. They chase indicators, read every pattern book they can find, and spend hours hunting for setups, then they blow up their account anyway. Why? Because winning trades are only half the equation. The other half is controlling what happens when you're wrong. That's where risk management lives, and it starts with two concepts that professional traders treat as non-negotiable: the risk/reward ratio and position sizing.
Get these right, and you can be wrong more than half the time and still make money. Get them wrong, and even a 70% win rate won't save you.
What Is Risk/Reward Ratio and How To Use It Effectively
The risk/reward ratio (often written as R:R) compares how much you stand to lose on a trade against how much you stand to gain. A 1:2 ratio means you're risking $1 to potentially make $2. A 1:3 means you're risking $1 to potentially make $3. Simple math, but the implications are enormous.
Here's why this matters so much: if you consistently trade with a 1:2 risk/reward ratio, you only need to win 34% of your trades to break even before commissions. Win 50% of the time, and you're solidly profitable. This is the mathematical engine behind every professional trading system.
Retail traders tend to do the opposite. They cut winners short (locking in small gains for emotional comfort) and let losers run (hoping they'll come back). This creates a negative risk/reward profile, perhaps a 2:1 ratio working against them. In this scenarios, they would need to win over 66% of trades just to break even. That's a brutal standard to maintain over hundreds of trades.
Institutional desks enforce minimum R:R thresholds before any trade gets approved. Many prop firms require at least a 1:2 before a trader can size up. This isn't arbitrary, it's basic survival math applied at scale.
How To Calculate Your Risk/Reward Ratio Before Entering a Trade
- Identify your entry price. Where are you getting in?
- Set your stop loss. Where does the trade idea become invalid? This defines your risk per share.
- Define your target. Where is the logical exit if the trade works? This defines your reward per share.
- Divide reward by risk. If your stop is $2 away and your target is $6 away, your R:R is 1:3.
A common mistake is setting targets arbitrarily (i.e. just picking a round number or a percentage). Strong targets are anchored to real chart levels: prior highs, resistance zones, measured moves from breakouts, or Fibonacci extensions. Your stop should be equally logical, just below a key support level or moving average. Don't just use round dollar amounts that "feel okay."

What Is Position Sizing and How To Calculate It Properly
Even with a great R:R ratio, one oversized trade can destroy weeks of gains. Position sizing answers the question: how many shares should I buy? The answer should never be "as many as I can afford." It should be calculated based on how much capital you're willing to risk on this specific trade.
The most widely used framework is the fixed percentage risk model, sometimes called the 1% or 2% rule. The idea is straightforward: never risk more than a fixed percentage of your total account on any single trade. Most professional traders risk between 0.5% and 2% per trade. Research on trader longevity consistently shows that traders who risk more than 2% per trade have significantly higher account blowup rates.
3 Steps To Calculate Position Size Using the Percentage Risk Model
- Determine your dollar risk per trade. If your account is $100,000 and you risk 1%, you're willing to lose $1,000 on this trade.
- Calculate your risk per share. Subtract your stop loss price from your entry price. If you're buying at $50 with a stop at $47, your risk per share is $3.
- Divide dollar risk by risk per share. $1,000 divided by $3 = 333 shares. That's your position size.
This approach automatically scales your position size based on the volatility of each setup. A wider stop means fewer shares. A tighter stop means more shares. Your dollar risk stays constant regardless of how wild the stock is. This is exactly how systematic hedge funds and algorithmic traders control drawdown — not by guessing, but by letting the math dictate size.
How Risk/Reward and Position Sizing Work Together To Build a Profitable System
These two tools are most powerful when used together. Consider a trader running a system with a 1:2 R:R and a 40% win rate, risking 1% per trade on a $100,000 account.
- 10 trades, 4 winners, 6 losers
- 4 winners x 2% gain = +8%
- 6 losers x 1% loss = -6%
- Net result: +2% on the account
That trader is profitable while being wrong 60% of the time. Now imagine the same trader ignores position sizing and risks 10% on a few trades. Two bad trades wipe out 20% of the account, and suddenly the math of recovery becomes brutal — you need a 25% gain just to get back to even after a 20% drawdown.
Drawdown recovery math is one of the cruelest forces in trading. Lose 50%, and you need a 100% gain to recover. This is why professional risk management focuses obsessively on limiting losses, not chasing gains.
How To Practice Risk/Reward Ratio and Position Sizing: The Van Tharp R-Multiple Assignment
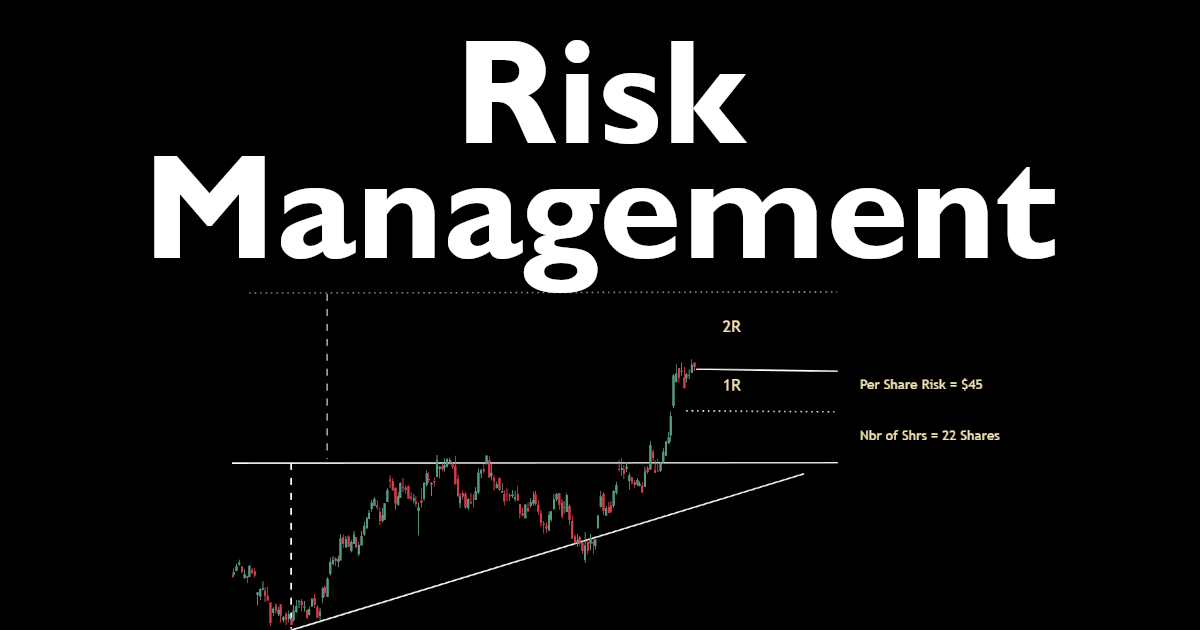
Dr. Van Tharp, a renowned trading coach and author of Trade Your Way to Financial Freedom, built an entire performance framework around what he called the R-Multiple. Every trade is measured in units of R, where 1R equals the initial risk on the trade. A trade that hits a 2R target returns twice the risk. A loss that hits the stop is -1R. Tracking your trades in R-Multiples removes dollar amounts from the equation and reveals the true quality of your system.
Tharp argued that a positive expectancy — the average R-Multiple across all trades — is the only real measure of a trading system's edge. Expectancy is calculated as: (Win Rate x Average Win in R) - (Loss Rate x Average Loss in R). A system with positive expectancy will make money over time given enough trades. Negative expectancy will drain the account no matter how good any single trade feels.

How To Practice the R-Multiple Framework on the Trading Blitz Simulator
This assignment will help you build the habit of defining risk before every trade and tracking your results in R-Multiples — exactly as Van Tharp prescribes.
- Reset your Game History on Trading Blitz (Dashboard) to clear out any old data and ensure you have clean statistics for this assignment.
- Open a new Solo session on Trading Blitz and load a new chart. Spend time reviewing the chart until you identify a clear setup — a breakout, a pullback to support, or a trend continuation pattern.
- Before clicking anything, write down three numbers: your planned entry price, your stop loss level (where the setup is wrong), and your target price (a logical resistance level or measured move). Calculate your R:R ratio. Only proceed if it's at least 1:2.
- Calculate your position size using 1% of your virtual account (e.g. $1,000 risk on a new account balance of $100,000). Divide $1,000 by your per-share risk (= entry price - stop loss price) to get your share count. Place your entry as a market or limit order and immediately set a stop loss order at your predetermined level.
- Record each trade in a simple spreadsheet with the following columns: Entry, Stop, Target, R:R Ratio, Outcome (in R). A full stop-out is -1R. A half-target exit is +1R. A full target is +2R (or whatever your ratio was).
- After 20 trades, calculate your expectancy. Are you running positive or negative? What's your average R-Multiple per trade? Which setups produce the highest R-Multiples?
The goal isn't to win every trade. The goal is to prove that your process has a positive expectancy. If it does, scaling up becomes a mechanical decision, not an emotional one. That's what separates professional traders from gamblers.
Premium users can filter for Breakout or Pullback chart patterns to focus on specific setups while running this exercise, which makes it easier to build a large enough sample size from comparable trade types.
Free Cash-Prize Touraments
We run free cash-prize tournaments (no entry fee required) when we go live on YouTube. Be sure to subscribe to our channel - @TradingBlitzSimulator - to get alerted when we go live next.
Citations
- Tharp, V. (1999). Trade Your Way to Financial Freedom. McGraw-Hill.
- Tharp, V. (2008). Van Tharp's Definitive Guide to Position Sizing. IITM.
- Schwager, J. (1989). Market Wizards. New York Institute of Finance. (Multiple interviews referencing 1-2% risk rules among professional traders.)
Disclaimer: Trading involves substantial risk of loss and is not appropriate for all investors. The information provided on Trading Blitz is for educational and informational purposes only. Nothing on this platform, including this article, constitutes financial advice, investment advice, or a recommendation to buy or sell any security. Simulated trading results do not guarantee or predict future performance in live markets. Past performance, whether real or simulated, is not indicative of future results. Always consult a qualified financial professional before making any investment decisions. For additional information, please see our Terms of Service.
Affiliate Disclosure: Some links in this article may be affiliate links. If you click through and make a purchase, Trading Blitz may earn a small commission at no additional cost to you. We only reference tools and resources we believe are relevant to traders.