For traders looking to understand market trends and make informed decisions, few concepts are as foundational as the Dow Theory. Whether you're new to technical analysis or looking to strengthen your trading approach, understanding this century-old framework can significantly enhance your market perspective.
Who Created the Dow Theory?
Dow Theory derives its name from Charles H. Dow (1851-1902), the founder of The Wall Street Journal and co-founder of Dow Jones & Company. While Dow never formally published his complete market theory, he expressed his ideas through a series of editorials in The Wall Street Journal between 1900 and 1902.
After Dow's death, his close associate William Peter Hamilton continued developing these concepts. S.A. Nelson and Robert Rhea further refined and compiled these ideas into what we now know as "Dow Theory." Rhea's 1932 book, "The Dow Theory," became the definitive work that formalized these principles.
What is the Dow Theory?
At its core, Dow Theory is a framework for understanding market trends and identifying potential trading opportunities. It was originally developed to analyze the Dow Jones Industrial Average and the Dow Jones Transportation Average, but has since been applied to various market indexes and individual securities.

The theory consists of six primary principles:
1. The Market Reflects Everything
This principle asserts that all available information—including current news, future expectations, and investor sentiment—is already reflected in market prices. This forms the basis of much of modern technical analysis.
2. Markets Move in Three Trends
According to Dow Theory, markets move in three distinct trends:
- Primary Trend: The main market direction lasting from one year to several years (the tide)
- Secondary Trend: Corrections to the primary trend lasting from three weeks to three months (the waves)
- Minor Trend: Short-term fluctuations lasting less than three weeks (the ripples)
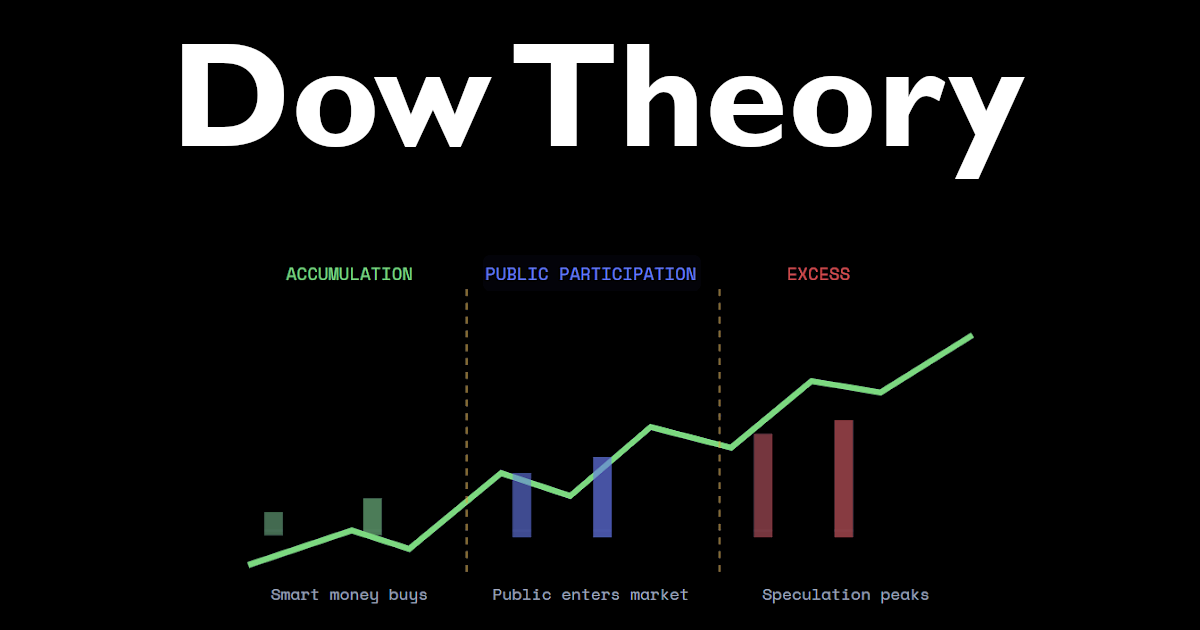
3. Primary Trends Have Three Phases
The primary upward (bull) trend consists of:
- Accumulation Phase: When knowledgeable investors begin buying against prevailing public opinion
- Public Participation Phase: When price movement attracts public attention, and more buyers enter the market
- Excess Phase: When speculation runs rampant and economic news is extremely positive
The primary downward (bear) trend follows a similar pattern in reverse:
- Distribution Phase: When informed investors begin selling
- Public Participation Phase: When the public begins selling
- Panic Phase: When sellers desperately exit positions at any price

4. Averages Must Confirm Each Other
For a market trend to be valid, Dow believed that related market indexes must confirm each other. In his time, this meant the Dow Jones Industrial Average and the Dow Jones Transportation Average had to move in the same direction. The logic was that if goods were being produced (indicated by industrial stocks) but not shipped (indicated by transportation stocks), something was amiss in the economy.

5. Volume Must Confirm the Trend
Volume should increase in the direction of the primary trend. In a bull market, volume should increase as prices rise and decrease as prices fall. In a bear market, volume should increase as prices fall and decrease as prices rise.
6. Trends Persist Until Definitive Reversal Signals Occur
A trend is assumed to continue until clear signals indicate a reversal. These signals typically involve failure to reach new highs or lows, followed by a break of important support or resistance levels.
Required Assumptions for Dow Theory to Work
For Dow Theory to be effective in your trading decisions, several assumptions must be accepted:
- Market Efficiency: You must believe that markets are generally efficient and that prices reflect all available information.
- Technical Sufficiency: The theory assumes that price action and volume contain all necessary information for analysis, without requiring fundamental data.
- Trend Importance: You must accept that identifying the primary trend is more important than trying to profit from minor fluctuations.
- Confirmation Requirements: The theory requires patience, waiting for confirmation between averages rather than acting on signals from a single index.
- Pattern Recognition: You must believe that market patterns tend to repeat themselves and can be identified through technical analysis.
How to Use Dow Theory in Your Trading Plan
Incorporating Dow Theory into your trading strategy requires a systematic approach:

Step 1: Identify the Primary Trend
Determine whether the overall market is in a bull or bear phase by analyzing long-term charts (1-year or more). Look for higher highs and higher lows (bull) or lower highs and lower lows (bear).
Step 2: Identify Secondary Reactions
Watch for corrections against the primary trend. These typically retrace 33% to 66% of the previous primary move.
Step 3: Wait for Confirmation
Ensure that related market indexes confirm the trend. While the original theory focused on industrial and transportation indexes, modern traders might look for confirmation between various sector indexes that should logically move together.
Step 4: Analyze Volume Patterns
Verify that volume increases in the direction of the primary trend and decreases during corrections.
Step 5: Enter Positions After Secondary Reactions
Consider entering positions in the direction of the primary trend after a secondary reaction has completed. For example, in a bull market, look to buy after a correction has finished and the primary uptrend resumes.
Step 6: Exit When Trend Reversal Signals Appear
Plan to exit positions when there are clear signals that the primary trend has reversed, such as failure to make new highs followed by breaks of significant support levels.
Potential Pitfalls When Using Dow Theory
While Dow Theory provides valuable insights, be aware of these common challenges:
- Lag Time: Dow Theory is not designed for short-term trading. Signals often come after significant moves have already occurred, potentially reducing profit potential.
- False Signals: Not all apparent trend changes result in actual reversals. This can lead to premature exits or entries.
- Subjectivity: Identifying trend phases can be subjective, leading to different interpretations among traders.
- Modern Market Complexity: Today's markets involve factors not considered in Dow's time, such as algorithmic trading, which may affect the theory's application.
- Index Correlation: In the modern market, traditional index relationships (like industrials and transportation) may not always provide reliable confirmation signals.
- Time Commitment: Properly applying Dow Theory requires consistent monitoring of multiple indices and timeframes.
Put It Into Practice: The Trading Blitz Dow Theory Drill
A Quick Note Before You Start
Traditional Dow Theory requires comparing two indexes, like industrials vs. transportation, to confirm a trend. The Trading Blitz simulator serves anonymous charts, so you won't have that. No ticker. No date. No second index.
That's actually fine. Most of what Dow Theory teaches you lives in a single price chart anyway. Think of this as practicing the 80% that matters most: reading the trend, timing your entry, and knowing when to walk away.
Before You Begin
Reset your Game History so you're starting with clean statistics. This way, when you review your results at the end, you'll know every trade in your Dashboard reflects this drill and nothing else.
The Three-Step Drill
Step 1: Read the Tape Before You Touch Anything
When the chart loads, don't click a thing. Just look.
Ask yourself one question: Is this chart making higher highs and higher lows, or lower highs and lower lows?
- Higher highs and higher lows: you're likely looking at a bull trend
- Lower highs and lower lows: you're likely looking at a bear trend
- Neither: the trend may be unclear, and that's a valid answer too
This is Dow's primary trend, the tide that everything else moves with. Once you've identified it, decide: Am I trading with this trend, or am I sitting this one out? Dow Theory doesn't reward fighting the tide.
Step 2: Wait for the Wave, Then Enter
Once you've identified the primary trend, don't chase it. Click 'Next Day' until you see a pullback.
In a bull trend, price rarely goes straight up. It advances, pulls back, then advances again. That pullback, what Dow called a secondary reaction, is your entry window. Wait for price to retrace roughly one-third to two-thirds of the prior move. Then, use an indicator as your trigger. You might select MACD or RSI. For this assignment, we're going to use RSI. We'll wait for RSI to cross back above a certain level (e.g. 30 or 50) before entering. You can experiment to find a level that works best for you. If you want a deeper understanding of how RSI works, check out our article: Relative Strength Index (RSI).
In a bear trend, the same idea applies in reverse. Look for the brief rally, the dead-cat bounce, and consider entering short into that bounce, not into freefall. In this case, watch for RSI to cross back below 70 or 50 as your trigger.
Volume check: Before you pull the trigger, glance at the volume bars. Volume should be heavier in the direction of the primary trend and lighter on the pullback. If price is rallying but volume is shrinking the whole way up, that may be a sign the move lacks conviction. A yellow flag, not a green light.
Step 3: Review Your Read After Every Trade
Win or lose, run through these five questions after each trade and record your answers in the Notes section of the simulator:
- Did I correctly identify the primary trend direction?
- Did I wait for a secondary reaction, or did I chase the move?
- Was volume supporting the trend I identified?
- Did I spot any reversal signals, a failure to reach a new high or a break of prior support, and if so, did I respect them?
- Was my trade with the primary trend, or was I fighting it?
Practice this on 10 to 20 charts. When you're finished, head to your Dashboard to review your stats. You'll be able to see how your results hold up when you're trading with the trend versus against it. Then, compare your notes and your stats to find areas where you can improve.
You don't need to get every chart right. You need to get the process right. The results follow from the process.
The Bottom Line
In the simulator, you don't know which stock you're trading or what year it is. That's the point. You're forced to read pure price and volume, with no news headlines to lean on and no earnings calendar to hide behind. That's exactly the kind of clean, unbiased read that Dow Theory was built for.
As the old trading saying goes: the trend is your friend. This drill is how you learn to recognize it.
Conclusion
Dow Theory remains relevant over a century after its creation because it addresses fundamental market behaviors that persist regardless of era or asset class. By understanding market trends, waiting for confirmation, and aligning your trades with the primary direction, you can develop a more disciplined and potentially profitable approach to trading.
Remember that like any trading methodology, Dow Theory works best when combined with proper risk management and when adapted to current market conditions.
Free Cash-Prize Touraments
We run free cash-prize tournaments (no entry fee required) when we go live on YouTube. Be sure to subscribe to our channel - @TradingBlitzSimulator - to get alerted when we go live next.
Disclaimer: Trading involves substantial risk of loss and is not appropriate for all investors. The information provided on Trading Blitz is for educational and informational purposes only. Nothing on this platform, including this article, constitutes financial advice, investment advice, or a recommendation to buy or sell any security. Simulated trading results do not guarantee or predict future performance in live markets. Past performance, whether real or simulated, is not indicative of future results. Always consult a qualified financial professional before making any investment decisions. For additional information, please see our Terms of Service.
Affiliate Disclosure: Some links in this article may be affiliate links. If you click through and make a purchase, Trading Blitz may earn a small commission at no additional cost to you. We only reference tools and resources we believe are relevant to traders.