The Head and Shoulders pattern is arguably the most recognized reversal pattern in all of technical analysis. It shows up across markets, across decades, and across asset classes with a consistency that has made it a cornerstone of both retail and institutional trading strategies. If you can spot it early and trade it correctly, it offers a well-defined entry, a logical stop loss, and a measurable price target — a rare trifecta in trading.
This article breaks down exactly what the Head and Shoulders pattern is, why it forms, what forces drive it, and how to trade it with discipline. By the end, you will know how to recognize the pattern on a live chart and how to practice finding it in the simulator.
What Is the Head and Shoulders Pattern and How Does It Form?
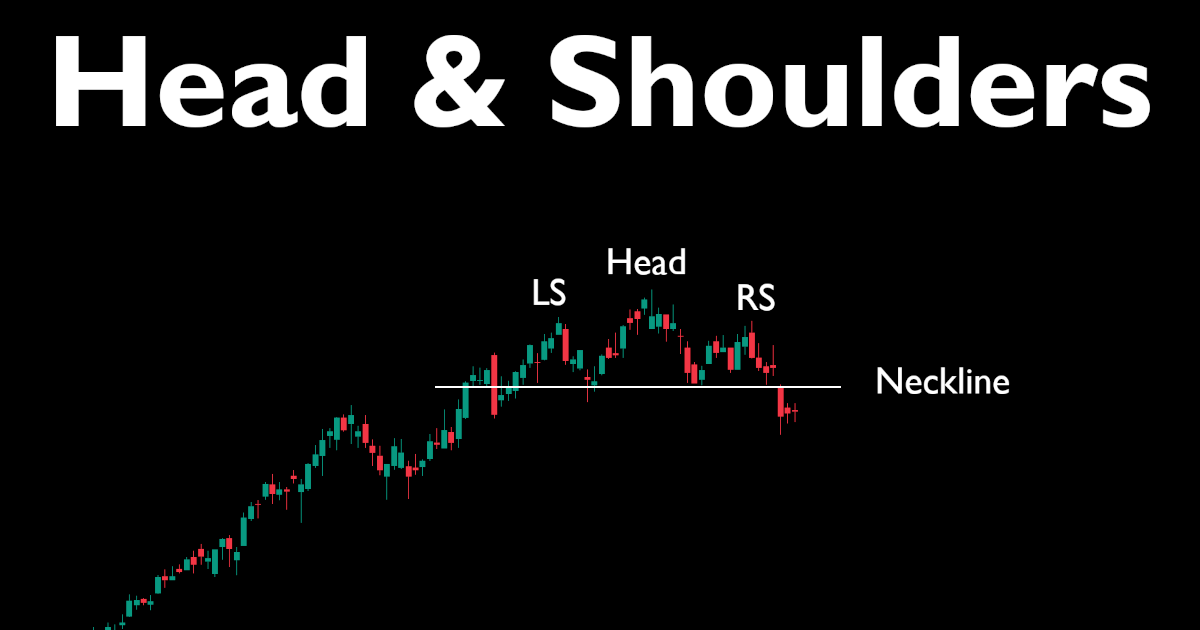
The Head and Shoulders is a bearish reversal pattern that typically appears after a sustained uptrend. It consists of three peaks: a left shoulder, a higher peak called the head, and a right shoulder that is roughly equal in height to the left. A support line called the neckline connects the two troughs between these peaks.
The inverse version, called the Inverse Head and Shoulders, is the bullish mirror image and signals a reversal from a downtrend to an uptrend. Both patterns follow the same logic, just in opposite directions.
Here is what each component looks like in sequence:
- Left Shoulder: Price rallies to a new high, then pulls back to support.
- Head: Price rallies again to an even higher high, then pulls back to roughly the same support level.
- Right Shoulder: Price makes one more rally, but it fails to reach the height of the head. It then falls back toward the neckline.
- Neckline Break: Price closes below the neckline, confirming the pattern and triggering the signal.
Why the Head and Shoulders Pattern Works: The Market Forces Behind It
Understanding why a pattern forms is what separates traders who use it confidently from traders who get shaken out. The Head and Shoulders pattern is not random, it reflects a very specific shift in the balance of power between buyers and sellers.
During the left shoulder, buyers are still in control. The pullback is healthy. During the head, buyers make one final aggressive push to new highs, but sellers absorb that move. Often the volume during the head will be lower than during the left shoulder, a sign that buying conviction is fading. By the time the right shoulder forms, buyers are exhausted. They cannot even match the previous high. Institutional traders and smart money are quietly distributing shares into this rally, offloading inventory to latecomers still chasing the trend.
When price breaks the neckline, the sellers overwhelm the buyers, stop-loss orders from trapped longs get triggered, and algorithms designed to sell breakdowns add fuel to the fire. The result is often a sharp, sustained move lower. According to Thomas Bulkowski's research in Encyclopedia of Chart Patterns (Buy on Amazon), the Head and Shoulders top pattern has a success rate of approximately 93% when measured by whether the price reaches its minimum target, making it one of the most reliable patterns documented in technical literature.
How To Measure the Price Target After a Neckline Break
One of the cleanest features of this pattern is its built-in price target. The measurement method is straightforward:
- Measure the vertical distance from the top of the head down to the neckline.
- Subtract that distance from the neckline breakout point.
- That gives you your minimum projected target.
For example, if the head peaks at $100 and the neckline sits at $85, the pattern height is $15. If the neckline breaks at $85, the target is $85 minus $15, which equals $70. This is a mechanical target — price can absolutely overshoot or reverse early, so it's only a guide, not a guarantee.

3 Common Mistakes Traders Make With the Head and Shoulders Pattern
1. Jumping in before the neckline breaks. Anticipating the pattern is tempting, but without confirmation, the right shoulder could extend into another rally and the pattern fails entirely. Wait for the close below the neckline.
2. Ignoring volume. A neckline break on thin volume is suspect. You want to see volume expand on the breakdown. Heavy selling volume confirms that institutional players are participating in the move, not just retail traders hitting stop losses.
3. Misidentifying an asymmetric pattern. Real markets do not produce perfect textbook patterns. The right shoulder does not need to be identical to the left — it just needs to be lower than the head and fail to reclaim the prior high. Flexibility here is appropriate, perfectionism is not.
How To Trade the Inverse Head and Shoulders for Bullish Reversals
Everything flips in the inverse version. After a downtrend, price forms a left trough, a deeper trough (the head), and a higher right trough. The neckline connects the two peaks between the troughs. When price breaks above the neckline with volume, that confirms a bullish reversal. The price target is measured by adding the pattern height to the breakout point, the same logic, just pointing upward.
This pattern is particularly powerful after a long bearish trend where selling momentum has clearly exhausted itself. Short sellers covering positions and fresh buyers entering together create a powerful fuel mixture that drives price higher quickly.
How Professionals Trade This Strategy
Dr. Alexander Elder, author of Trading for a Living, emphasizes a multi-confirmation approach when trading reversal patterns. For the Head and Shoulders, his framework requires three things to align before entry: the pattern structure itself, a momentum shift confirmed by MACD, and a volume spike on the breakout bar.

Elder's logic is that any single signal can generate a false positive. When the pattern, momentum, and volume all agree, the probability of follow-through increases substantially. He is particularly cautious about entering on the first bar of the break. He often waits for a retest of the neckline from below (now acting as resistance) to enter with a tighter stop and better reward-to-risk setup.
How To Practice Identifying Head and Shoulders Patterns on the Trading Blitz Simulator
Your Assignment: The Elder Confirmation Method on the Simulator
- Rest Game History: Before you begin, reset your Game History in your Dashboard to ensure you aren't including any old data in your results.
- Load new charts in Solo Mode until you find a prolonged uptrend followed by a three-peak formation where the middle peak is the highest. To save time, you can subscribe to Trading Blitz Premium and filter charts by Breakdown, Breakout, and Pullback. See below.
- Add the MACD indicator to your chart. Watch for the MACD line to cross below the signal line as the right shoulder develops. This is your momentum confirmation.
- Identify your neckline by connecting the two pullback lows between the left shoulder and the head, and between the head and the right shoulder.
- Wait for the neckline break. Use a stop order to sell the stock short at or below the neckline so it triggers automatically when the bar closes below it. Do not enter the short position before the break.
- Set your stop loss above the right shoulder. This level should not be reclaimed if the pattern is valid.
- Calculate your price target using the head-to-neckline distance and project it downward from the breakout point. Then, begin clicking Next Day to see how the pattern unfolds. Consider taking partial profits at the target.
- Look for a neckline retest. After the initial break, price sometimes bounces back to the neckline. If it stalls there and turns lower again with the MACD remaining bearish, that is a second entry opportunity with an even tighter stop.
- Repeat with 10 to 20 charts. In the Notes section of the Simulator, track how often the pattern produces a successful move to the measured target. Note which confirmation signals (volume expansion, MACD crossunder) were present in your winners versus your losers.

If you are a premium member, use the Breakout or Pullback filters to load charts in uptrends that could start forming head and shoulder patterns. Alternatively, you could use the Breakdown filter to load charts where a significant support level has recently been broken. These charts are more likely to contain completed or near-complete Head and Shoulders patterns, making your practice sessions more efficient.
Consistency is what builds the pattern recognition you need. Ten or more focused practice sessions will teach you more about this pattern than reading about it ten more times.
Free Cash-Prize Touraments
We run free cash-prize tournaments (no entry fee required) when we go live on YouTube. Be sure to subscribe to our channel - @TradingBlitzSimulator - to get alerted when we go live next.
Citations
- Bulkowski, T. N. (2005). Encyclopedia of Chart Patterns (2nd ed.). Wiley Trading.
- Elder, A. (1993). Trading for a Living: Psychology, Trading Tactics, Money Management. Wiley Finance.
Disclaimer: Trading Blitz is a simulation platform intended solely for educational and informational purposes. Nothing published on Trading Blitz, including this article, constitutes financial advice, investment advice, or a recommendation to buy or sell any security. All trading involves substantial risk of loss, and past performance — whether in a simulator or in live markets — does not guarantee future results. Paper trading results may not reflect the outcomes you would experience trading real capital due to differences in execution, psychology, and market conditions. You should consult a qualified financial professional before making any investment decisions. For additional information, please see our Terms of Service.
Affiliate Disclosure: Some links in this article may be affiliate links. If you click through and make a purchase, Trading Blitz may earn a small commission at no additional cost to you. We only reference tools and resources we believe are relevant to traders.